|
Telangana state faced power shortages at the time of its formation, in 2014, and significant thermal capacity additions were planned to address this challenge and to meet high projected demand. Now, eight years hence, power shortages no longer persist, but the growth in demand has been muted in comparison to the projections. However, the thermal capacity planned in 2015 is still on track to come up without any review or revision to reflect recent changes in the state’s power sector. In this article, we look at the changing patterns in demand, comparing past trends with future projections, and attempt to assess the impact of the pipeline capacity addition on the state’s power sector in the medium term. Such capacity coming online without consideration of recent developments such as muted demand growth, increasing RE, sales migration, and the role of market purchase, could result in issues like stranded capacity and resource lock-ins, which have long term implications for the state’s power sector. |
After its formation in 2014, Telangana State (TS) planned to bring online significant thermal capacity. Most of these capacity additions have been plagued by procedural delays and some of this capacity still remains in the pipeline. Despite the fast-paced changes in the state’s power sector, the muted demand growth, and the extant surplus base load capacity, this pipeline capacity addition plan has not been reviewed or revised. Like in other states, excess capacity addition is an unfortunate feature in TS as well. With cheaper, cleaner, and more efficient alternatives for power supply, the thermal capacity in the pipeline is likely to be a big burden on the state’s distribution companies (DISCOMs), and thereby its consumers, and hence merits review.
1. How much power is needed?
In this section, the demand scenarios over two time periods are assessed; the past period from FY15 to FY19, and the next time period from FY20 to FY24. Consistent and public demand data for FY15-FY19 is sourced from the Power for All (PFA) initiative for projections, and from the DISCOM annual reports and Southern Load Dispatch Centre (SLDC) quarterly reports for actuals. Demand projections for FY20-FY24 are from the Multi-year tariff proposals and actuals for few years from the FY23 Annual Revenue Requirement submissions of TS Distribution Companies.3
1.1. First five years, FY15-19
Massive capacity addition was planned in the newly formed Telangana state on the basis of an Energy Task Force Report (2014) and Power For All (PFA) initiative (2015). PFA plans for demand growth and capacity addition for FY15-FY19 were extremely ambitious, as can be seen in Table 1. Compounded Annual Growth Rate (CAGR) is for the period from FY15 to FY19.
Table 1. Ambitious demand projections
| Demand parameter | Unit | FY19 | CAGR (%) |
| Energy PFA | BU | 106 | 20 |
| Energy CEA | BU | 68 | 12 |
| Energy Actual | BU | 64 | 9 |
| Peak demand PFA | GW | 19 | 23 |
| Peak demand CEA | GW | 11 | 16 |
| Peak demand Actual | GW | 11 | 12 |
Source: Prayas (Energy Group) compilation based on PFA agreement, Annual reports of TS DISCOMs (FY15-19), 19th EPS of CEA, SRLDC 4th quarterly report FY19.
These projections were made without any detailed public consultations. It can be seen from Table 1 that projections from the state’s PFA document were much higher than the Central Electricity Authority’s (CEA) projections or the actual energy CAGR of 9% for the previous five years, FY09 to FY14.
The high demand growth sectors identified in PFA were agriculture (mostly due to massive lift irrigation projects and due to increasing hours of Low Tension (LT) agriculture supply from 7 to 9 hours), High Tension (HT) industry (due to Bayyaram steel plant, industrial parks and Hyderabad metro) and domestic (due to electrification and higher consumption). Demand growth was also expected due to the lifting of power curtailment. But actual demand CAGR during FY15-19 was quite low, with the actual energy and peak demand in FY19 being only around 60% of the PFA projections, as seen in Table 1.
Table 2 captures the projected and actual demand growth during FY15-FY19 for key consumer categories – HT industry, LT domestic, and HT and LT agriculture - which together account for 87% of the demand in FY19. It can be seen that actual demand growth rates were far lower than what was projected in the PFA, except for agriculture, and that was mostly due to HT lift irrigation projects4. In addition to lower demand growth rates of domestic and industrial consumers, migration through open access and captive also could be the reasons for the low overall demand growth.
LT agriculture consumption is not likely to increase in near future, since 24- hours supply is already being offered, rains have been good in the past few years, government has been discouraging paddy cultivation and possible shift to canal irrigation.5
Table 2. Ambitious growth rate projections
| Category | % of total consumption FY19 actual | CAGR- PFA (%) | CAGR – Actual (%) |
| LT & HT Agriculture | 41 | 27 | 39 |
| HT Industry | 26 | 16 | 5 |
| LT Domestic | 20 | 24 | 7 |
| Total demand | 20 | 9 |
Source: Prayas (Energy Group) compilation based on PFA agreement, Annual reports (FY15-19) of TS DISCOMs
1.2. Next five years, FY20-24
The 19th Energy Power Survey (EPS) of CEA and the Multi Year Tariff (MYT) tariff petitions of Telangana utilities give energy projections for the next five years, FY20 to FY24. These details are given in Table 3.
Table 3. Demand scenario from FY20 to FY24
| Parameter | Units | FY20 | FY21 | FY22 | FY23 | FY24 | CAGR (%) |
| Energy projection CEA | BU | 75 | 81 | 85 | 88 | 92 | 5.1 |
| Energy projection TS | BU | 73 | 78 | 85 | 90 | 95 | 6.7 |
| Energy actual | BU | 66 | 67 | ||||
| Peak projection CEA | GW | 13 | 14 | 14 | 15 | 16 | 6.1 |
| Peak projection TS | GW | 15 | 16 | 20 | 20 | 21 | 8.1 |
| Peak actual | GW | 13 | 14 |
Source: Prayas (Energy Group) compilation based on CEA 19th EPS, MYT petitions of TSTRANSCO and DISCOM Annual report (FY20), TS power supply position by the load monitoring cell (FY20 and FY21)
The CAGR figures in Table 3 indicate sober growth rate projections by TS utilities for FY20-24, compared to that given in PFA. The overall energy growth rate projected is 6.7% and the only consumer category expected to show high growth is HT agriculture, at 14%. Peak demand contribution of HT agriculture, which typically operates for 16 hours on 120 days is projected as 7,684 MW in FY24 (37% of the total peak demand) and energy demand is projected to be 22% of the total demand. Therefore, the demand profile in FY24 is highly dependent on lift irrigation projects.
The ARR submissions by DISCOMs for FY23 indicate muted demand growth for the first years of this control period. Lift Irrigation sales for FY21 and FY22 is only about 24% of the MYT projections, but in FY23, it is expected to reach 70% of the projections. This requires close monitoring. The actual total energy purchase for FY21 is 67 BU, estimate for FY22 is 72 BU and projection for FY23 is 83 BU, all lower than the MYT projections.
2. How much power is available?
Much of the capacity addition planned for TS in FY15 was in response to shortages at the time of state formation, and the overestimated energy requirement, as seen in the previous section. As per PFA, contracted generation capacity was to increase nearly four times - from around 8 GW in FY15 to around 30 GW in FY19. Despite changing dynamics and conditions on ground, there has been no mid-term course correction, and these plans have not been revised and the projects slated to come online are still in the pipeline. Given the dated planning and scope of the projects themselves, such capacity additions to the existing capacity available, could lead to major challenges and long term lock-ins in the state’s power sector.
2.1. Existing capacity and generation profile
Power procurement by Telangana DISCOMs has grown from around 14 GW to 16 GW between FY18 and FY216, as seen in Figure 1. The increase in installed capacity during this period is driven predominantly by private renewable capacity additions, with it accounting for 61% of the capacity increase between FY18 and FY21. The remaining additional capacity is attributed to thermal capacity under central and state ownership. A significant portion, around 40%, of the capacity procured in the time period considered comes from the state generating company, TSGENCO. This state capacity includes thermal and hydro sources, with thermal making up the majority share.
Figure 1. Ownership-wise power procurement by Telangana DISCOMs in FY18, FY20 and FY21
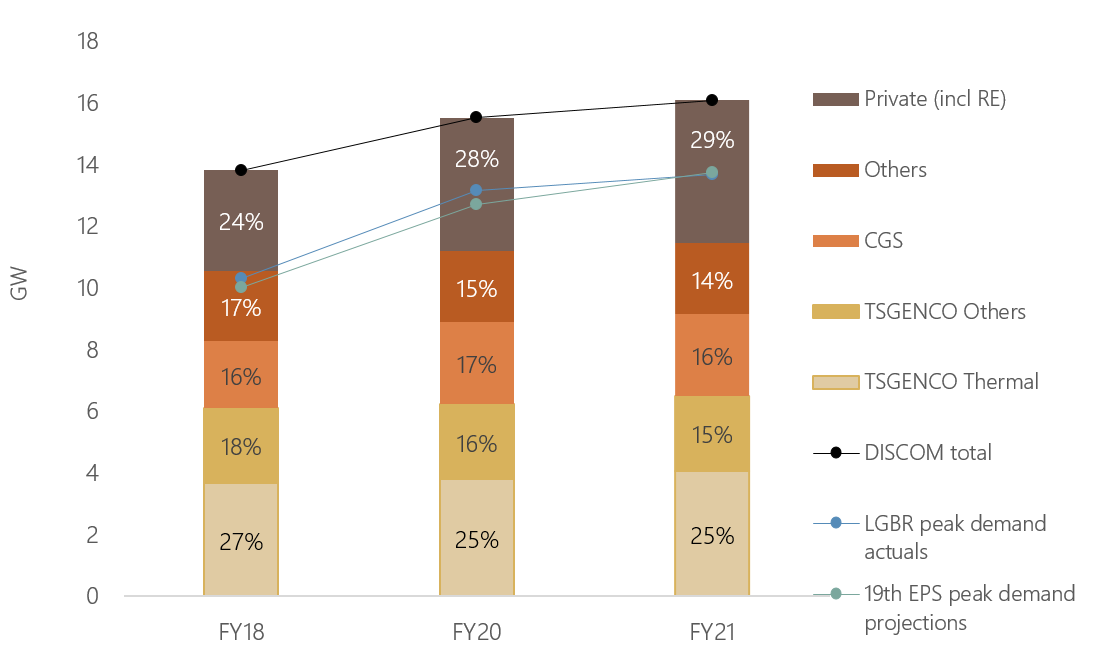
Source: Prayas (Energy Group) compilation based on regulatory documents, TRANSCO and SLDC reports
In fact, thermal capacity from state, central, and private sources, has constituted around 60% of the procured capacity since FY18, with the remaining capacity coming from hydro, gas, nuclear, and renewable sources. The share of capacity procured from thermal and other sources has remained roughly consistent from FY18 to FY21. However, the share of RE in the procured capacity increased from 17% in FY18 to 24% in FY21. This increase was predominantly driven by solar capacity additions from private generators.
This growing procured capacity by the state DISCOMs, has been in excess of the 19th EPS peak demand projections and the actual energy requirement, as corroborated by CEA’s Load Generation Balance Report (LGBR). The 19th EPS projection for energy requirement, on the other hand, is more than the actual energy requirement as reported by the LGBR and the state’s load monitoring cell, as illustrated in Figure 2.
The generation from the DISCOMs’ procured energy increased from around 60 BU in FY18 to 67 BU in FY21. Of this, TSGENCO’s thermal capacity generated around 29% across the years.
Figure 2. Energy generated from DISCOMs' procured capacity in FY18, FY20, and FY21
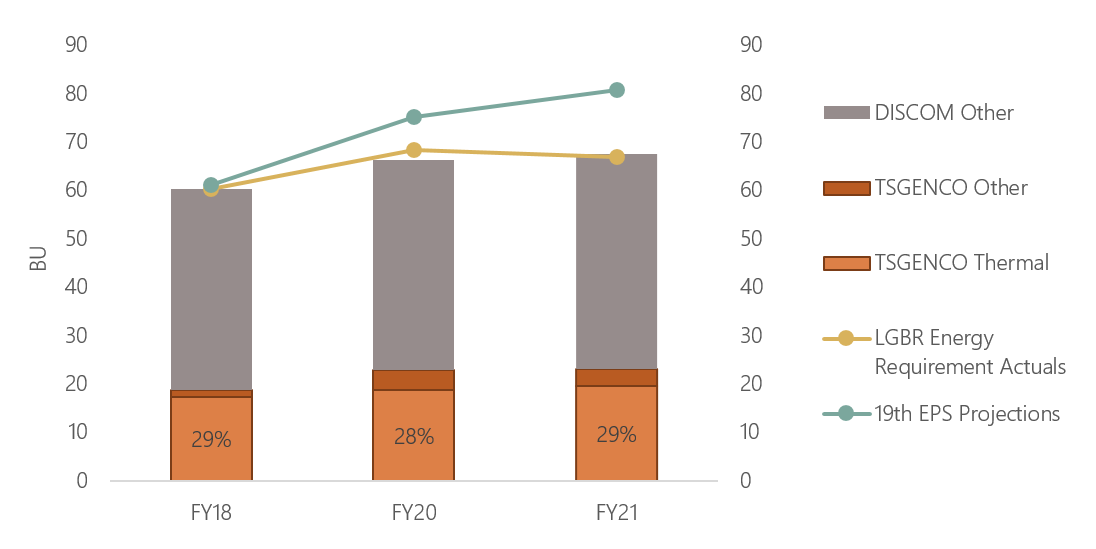
Source: Prayas (Energy Group) compilation based on regulatory documents, TRANSCO and SLDC reports
Note: DISCOM Other is the power procured from all non-TSGENCO sources
From Figure 1 and Figure 2, it is seen that the existing capacity and generation from DISCOM procurement alone has been able to meet Telangana’s actual energy requirement. The state has not faced a deficit in power supply in the recent past. The capacity addition in the pipeline, however, does not account for this current reality.
2.2. Capacity addition in the pipeline
Table 4 lists the planned capacity addition for TS till FY24. The capacity in the pipeline is comparable to half the existing capacity. Almost 80% of the intended capacity is thermal, and around 50% of it is state owned thermal capacity.7
Table 4. Planned capacity addition in Telangana till FY24
| FY21 | FY22 | FY23 | Total in FY24 | |
| Total | 16 GW | 20 GW | 25 GW | 25 GW |
| Includes: | ||||
| TSGENCO thermal capacity addition | 0.27 GW (Bhadradri IV) | 4 GW (Yadadri I-V) | 4.27 GW | |
| Central thermal capacity addition | 1.9 GW (Ramagundam and central share) | 1.9 GW | ||
| Others thermal capacity addition | 0.8 GW (Singareni II) | 0.8 GW | ||
| RE | 2 GW (Solar) | 2 GW | ||
Source: Prayas (Energy Group) compilation based on regulatory documents and SLDC reports
The projects in TSGENCO’s basket, Bhadradri Thermal Power Station (BTPS) and Yadadri Thermal Power Station (YTPS) had been announced as early as FY15, as seen in the state’s PFA document. They were initially intended to come online by FY19. However, both the projects have yet to be completed. BTPS is a four unit, 1080 MW project, of which 3 units have come online as of FY21. BTPS also operates on less efficient, sub critical technology. YTPS, a super critical project with five 800 MW units, is slated to come online by FY23-24. The delay in timelines has also impacted the expenditure on these projects. For instance, according to the CEA’s Broad Status Report for October 2021, the final project cost estimates for YTPS was Rs. 29,965 Crores, a 19% increase from the original project cost of Rs. 25,099 Crores. The original cost estimate for BTPS was Rs. 7,290 Crores, whereas the latest estimated cost is Rs. 10,515 Crores, a 44% increase. In addition to having high project costs, BTPS also has high operation cost. At a pooled cost8 of Rs. 5.8/kWh, BTPS is currently the most expensive TSGENCO thermal project at almost 40% more compared to the pooled per-unit power purchase cost. On the other hand, there is little clarity on the operational cost and tariff impact of YTPS, in spite of its scale and its projected commissioning in the medium term.
In comparison, power from central sources such as NTPC Ramagundam I & II, and NLC TPS I & II are procured at a pooled cost of Rs. 3.18/kWh and Rs. 3.5/kWh, on average. These central stations are also cheaper than most other TSGENCO thermal stations, and their pooled costs remain comparable even when including transmission charges and losses. The variable cost of these central stations is also comparable to that of TSGENCO thermal plants, including BTPS9. Despite this, the state’s DISCOMs’ have proposed to relinquish their allocated share of 529 MW from these generating stations (as per the TSERC order dated 17th November 2021), while bringing on comparatively less economically viable capacity like BTPS and YTPS.
Further, the ARR filings by DISCOMs for FY23 indicate that even power from other low variable cost thermal power sources like Marwa in Chhattisgarh are procured at low PLF – 37% in FY21 and 52% in FY22 - compared to over 70% of TSGENCO thermal plants.10 If this is due to the neglect of merit order dispatch, it would lead to increase in power purchase cost.11
The thermal capacity in the pipeline is also not adjusted in response to the growing renewable energy (RE) in the state. While 2 GW of solar capacity additions are considered, there may be more capacity coming online, spurred by national RE targets and the state’s own Renewable Purchase Obligations (RPO). Power procured by the DISCOMs’ from market and short term purchases12 has also been increasing significantly. The influence of purchase from such sources varies month on month, and has been especially pronounced in the months of March and February over the last few years. For instance, in March 2021, power purchase from short term sources was comparable to 27% of the DISCOMs’ contracted power, as per CERC’s monthly report on short term transactions of electricity. Moreover, TSDISCOMs have an agreement with PTC Limited for short term procurement of 550 MW for six months in a year, from FY21 to FY23.13 Market operations have been increasing all over the country with many more market instruments and availability of power from different sources. Even though this is a volatile option, it is worth exploring it for requirements like lift irrigation, which operate only for 16 hours in four months in a year. It is likely that availability of power from such market sources will continue to be considered to meet demand in the future, which further casts doubt on the need for the capacity addition in the pipeline.
Additionally, realistic, revised and current demand estimates have not been effectively considered when planning for the capacity in the pipeline. The need for such thermal capacity addition, especially one at the magnitude of YTPS, is not substantiated by the demand growth in the state. Owing to this, the capacity in the pipeline is likely to be highly overestimated, as is illustrated through scenarios in the next section.
3. How will capacity addition impact the TS power sector in FY24?
Toward understanding the role of the pipeline capacity in addressing Telangana’s power demand, this study has modelled three demand and supply side scenarios for FY24, compared against a baseline of FY20. The parameters on the demand side include demand from Lift Irrigation and Other sales, captive and open access generation, and the projections for peak demand. On the supply side, the existing and additional capacity procured by the DISCOM, and the corresponding generation, has been considered. State DISCOMs often do not account for RE sources in their projections to address future demand, as they consider RE infirm or unreliable. However, while RE sources are variable and intermittent in nature, they are likely to grow in share and play an important role in the state’s power sector, given better forecasting and RE integration capabilities as well as economic and policy drivers. Despite this, the supply side considerations for the scenarios do not include RE sources. This has been done to assess the DISCOMs’ ability to meet its demand even without considering a significant source of generation like RE. In each scenario, the demand, adjusted for captive and open access, is compared against the generation from non-RE sources procured by the DISCOMs’. The DISCOMs’ procured capacity is also compared against the projected peak demand. Figure 3 shows the results across the scenarios.
Figure 3. Scenarios for FY24
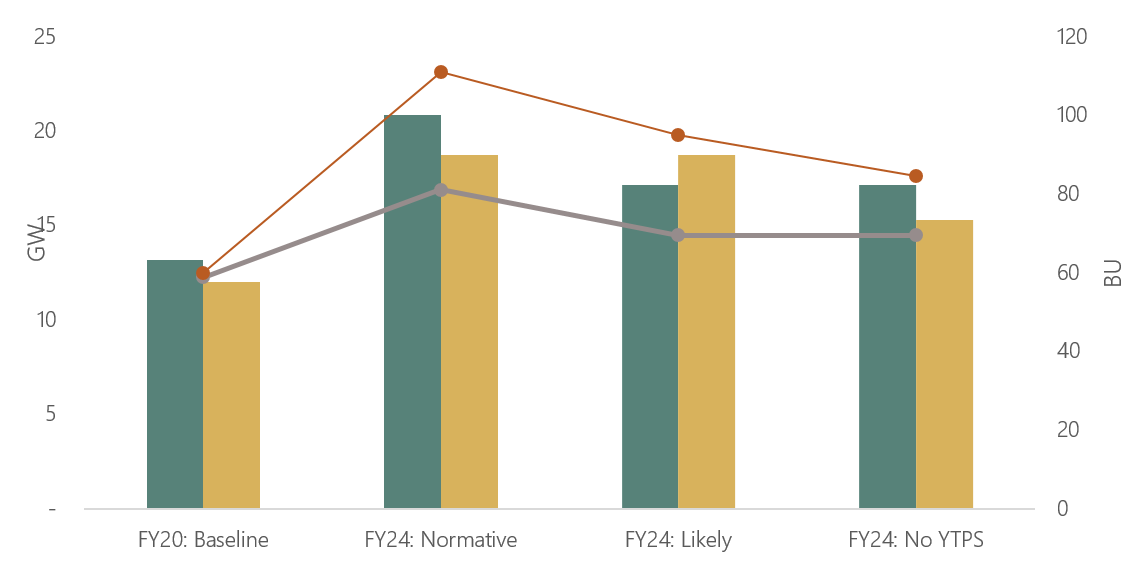
Source: Prayas (Energy Group) compilation based on regulatory documents, TRANSCO and SLDC reports
| Legend | Parameter (unit) | FY24: Normative Scenario | FY24: Likely Scenario | FY24: No YTPS Scenario |
 |
Peak demand (GW) | 20.8 | 17 | 17 |
 |
DISCOM capacity without RE (GW) | 18.7 | 18.7 | 15 |
 |
Adjusted demand (BU) | 81 | 69.5 | 69.5 |
 |
DISCOM generation without RE (BU) | 111 | 95 | 84.6 |
The first scenario, i.e. the normative scenario for FY24, considers demand and capacity additions as projected by the state. It takes into account the impact of relinquishing central stations. It assumes that any additional capacity generates at the normative plant load factor (PLF) of 85%, as stipulated in the state’s generation tariff regulations. In this scenario, the peak demand is 1.1 GW in excess of the DISCOM’s procured capacity without RE, but the generation from this capacity is around 36% more than the projected demand, adjusted for sales migration14, as seen in Figure 3.
The second ‘likely’ scenario accounts for a more realistic projection, based on past trends and inputs from sector actors. On the demand side, lift irrigation sales and the peak demand have been revised downwards. For supply estimates, the additional capacity is considered to generate at the TSGENCO reported PLF for BTPS online units (60%). It also includes the impact of surrendering 529 MW of central allocations. In this case the demand side requirements are more than met by the DISCOMs’ procured capacity without RE, and the corresponding generation.
In the third scenario, it is assumed that the YTPS project does not come online. The demand side is kept identical to that in the likely scenario. On the supply side, it is assumed that the remaining TSGENCO fleet and the additional central and others capacity generates at a PLF of 70%, which is still lesser than the normative PLF. It does not include the surrender of central allocation, considered in the previous scenarios. Even so, generation from the DISCOMs’ non-RE procured capacity is sufficient to meet the adjusted demand, as the DISCOMs’ generation surpasses it by around 22%.
It is noted that the DISCOMs’ procured capacity falls short of the peak energy demand in the first and third scenario. However, the above scenarios based on energy do not take into account the 5.8 GW of RE capacity that is likely to be available to the DISCOMs’ in FY24. This and checking for capacity adequacy (in MW terms) require further analysis based on load duration curves and generation patterns, which are not available in the public domain.
The capacity planning in TS seems to be based on the 21 GW peak demand projection for FY24, which occurs only in September, and that too for a few hours. Analysing the monthly peak demand projections given in the TSTRANSCO MYT petition for FY24 and the TS load curves from SRLDC monthly reports for FY22, it appears that the peak load of TS is likely to be above 18 GW only for 3-4 months in FY24. From these sources and the POSOCO report on load factor, it can be seen that the TS annual load factor (average demand/peak demand) has reduced from 70% in FY17, to 56% in FY21 and is expected to reduce further to 52% in FY24. In such a low load factor situation, to quote the POSOCO report, “Declining load factor is a signal for planning flexible generation and transmission assets instead of base load or inelastic resources.”15 But in FY24, the planned contracted base load thermal capacity is about 15 GW, which is 65% of the total.
The pipeline thermal capacity addition, along with growing RE, is likely to result in excess capacity as well generation in TS in every scenario. A proper analysis using realistic demand patterns in FY24 and availability of power from RE sources (which are must run and have to be procured) and market resources should be carried out to reassess the requirement of base load thermal capacity.
5. Conclusions
Even the initial, ambitious demand projections for the state of Telangana, and the capacity addition to address such demand, were prepared in a non-transparent manner. Neither the projections, nor the capacity additions have since been revised to reflect the many recent changes in the state’s power sector, such as the muted demand growth, increasing RE, sales migration, and the role of market purchase. Thus, it can be said that the thermal capacity slated to come online by FY24 is based on dated and insufficient reasoning, and could result in unfortunate consequences such as surplus power, stranded capacity, and locked-in resources and investments. TS DISCOMs have been incurring financial loss from FY15 and, as per PRAAPTI (Payment Ratification and Analysis in Power procurement for bringing Transparency in Invoicing of generator) portal, owe Rs. 7,368 Crore to generators, as of December 2021. The addition of pipeline capacity like YTPS, without review, would not be prudent, and could further worsen the finances of the DISCOMs.
To avoid such a situation, Telangana utilities and Telangana State Electricity Regulatory Commission (TSERC) could initiate some urgent actions to ensure mid-course corrections. Firstly, TSERC could ensure early PPA approvals through public process and timely tariff as well as true up petitions. There has been a very long delay in the retail tariff revision processes since November 2018 till December 2021, when tariff petitions for FY23 were submitted. Such shortcomings are not healthy for the sector. PPA for YTPS has not been discussed in public hearings and supply true-up petitions for many years are pending.16 Secondly, a revised load forecast and resource plan should be prepared by the TS utilities and finalised by the TSERC, after public consultation. The reasonability of demand projections, including that of HT lift irrigation projects and the tariff from YTPS units should be particularly examined. Since this project is under construction and claimed to be cost effective, state should explore the option of selling its power in the market, rather than contracting it to DISCOMs.17
Given the medium-term timeframe discussed, timely action on these fronts are crucial. By taking steps in the right direction, Telangana power sector could effectively bring on cleaner, cheaper capacity while ensuring stability and cost effectiveness in power supply to its consumers.
Endnotes
1. The authors thank Raghu K (PMGER), Thimma Reddy (PMGER), M Venugopala Rao (Centre for Power Studies), Ashok Sreenivas (PEG), and Ann Josey (PEG) for their valuable review of the draft.
2. This article is part of an ongoing series called Power Perspectives which provides brief commentaries and analyses of important developments in the Indian power sector, in various states and at the national level. Comments and suggestions on the series are welcome and can be addressed to
3. The period from FY5-19 has been discussed in the Telangana state overview article of Power Perspectives.
4. In case of LT agriculture, during this period, supply duration was increased from 7 to 9 hours (April 2016) and 9 to 24 hours (January 2018). High annual growth rate in agriculture consumption is reported in FY17, 18 and FY19 (25,27 and 14% respectively), but in FY20 and FY21, agriculture consumption has marginally reduced, compared to FY19.
5. Please also refer to the Power Perspective update on Telangana 24 x 7 agriculture supply.
6. Consistent data across the considered sources was unable for FY19, so the financial years considered in this section are FY18, FY20, and FY21.
7. Singareni is a joint sector project, with TS having majoring ownership, but is not included in TSGENCO capacity
8. Pooled cost of power purchase is the weighted average pooled price at which the distribution licensee has purchased electricity in the previous year from all the long term energy supplies.
9. BTPS has a variable cost of Rs. 2.52/kWh. Variable cost for Ramagundam I & II is Rs. 2.46/unit, and for NLC TPS II Stage 1 & 2 it is Rs. 2.74/kWh (as per TSSPDCL letter to TSERC dated 13th September 2021).
10. From the ARR filing of TS DISCOMs, see Section 3.3.4 of the filing of TSSPDCL.
11. As per the MoP website on Merit order dispatch, Marwa with Variable cost of Rs.1.2/kWh is the cheapest, followed by many Central Government plants, with KTPS V with variable cost of Rs. 2.84/kWh as the next cheapest TSGENCO thermal plant (data for 15/12/21, accessed on 6/1/22).
12. Market purchases include purchases through bilateral set ups, exchanges, and demand side management with the regional grids.
13. From the ARR filing of TS DISCOMs, see Section 3.3.3 of the filing of TSSPDCL.
14. Open Access and captive sales have been estimated as to 10% and 4.3% respectively of DISCOM sales in FY20 (baseline scenario), as compiled from CEA’s general review and other regulatory documents. The same values have been considered for FY24 across all three scenarios.
15. See “Seasonality analysis of load factor - Indian Power System perspective”, Report by POSOCO, June 2021
16. Please also refer the Power Perspective update: A commentary on limited regulatory oversight in Telangana.
17. As per FY23 ARR submissions, power purchase from YTPS Unit 1 in FY23 is at fixed cost of Rs. 1.99/kWh and variable cost of Rs. 2.49/kWh. The variable cost projected is lower than that of Singareni or Central thermal stations.