
Prayas (Energy Group) conducted a survey of 3000 households in semi-urban and rural areas of Uttar Pradesh and Maharashtra to understand their energy end-use patterns. This survey was conducted in February-March 2019. ECHO is a series of blog posts presenting the key findings of the survey. This post briefly discusses the sampling plan of the survey and formulation of asset index used to categorize households.
Sampling Plan
The residential energy consumption survey was conducted on 1500 semi-urban and rural households each from Uttar Pradesh and Maharashtra. Each state has five different regions with fairly distinct climates, geographies, and cultures. These regions are also reflected in administrative divisions of each state.
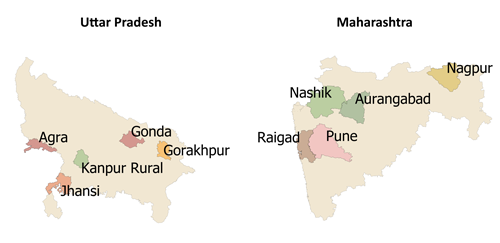
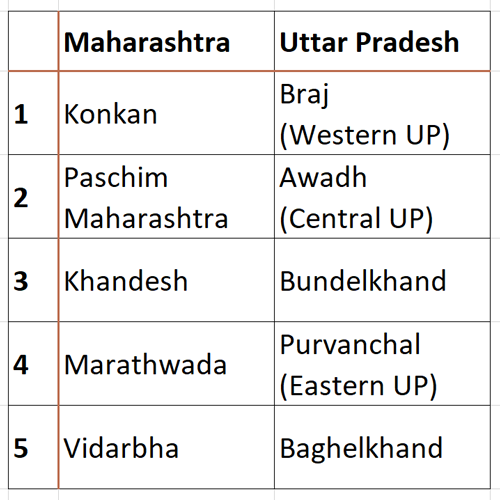
Figure 1: Regions and districts in sample
We chose one district from each of the regions and sampled 300 households within that district. These 300 households were equally distributed in three tehsils geographically spread across the district. In each tehsil, 50 households were chosen in a semi-urban area, 25 households in large village, and 25 households in small village. As per the Reserve Bank of India (RBI)’s classification, semi-urban is a town with a population between 10,000 and 1,00,000 while population of rural areas is less than 10,000. We further identified a village with a population between 7000 and 10,000 as a large village and a village with a population between 3,000 and 7000 as a small village. Hence, sample in each state has equal number of semi-urban and rural households distributed across 15 towns and 30 villages in 5 districts. In each town or village, surveyors used a pre-identified set of visual indicators to ensure households from different income levels are chosen. These visual indicators included size of the house, structure (kaccha/pucca), ownership of vehicles among others.
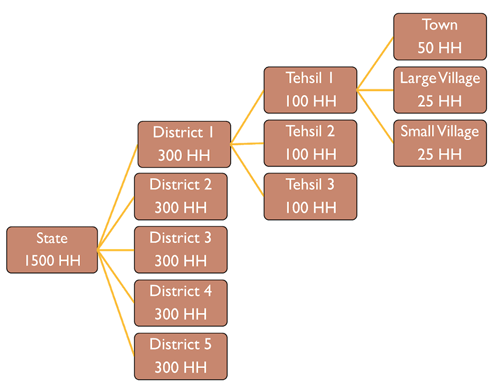
Figure 2: Sampling plan
Asset Index
We use the Asset Index method to categorize the households into low, medium, and high income.
Asset Index is computed based on ownership of certain appliances and certain household characteristics (see Figure 3). The underlying assumption is that these appliances and characteristics can explain a household’s long-term wealth better than the income stated by households in the survey (Filmer, 2001).
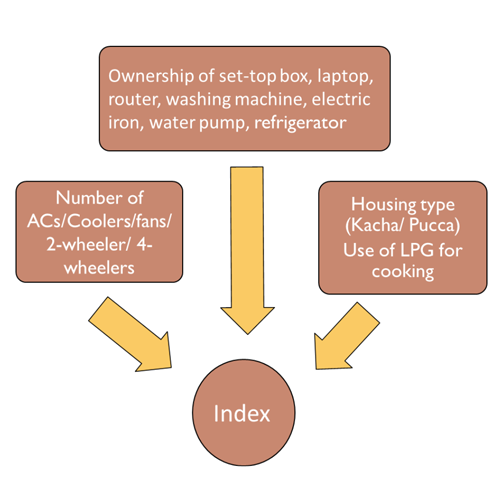
Figure 3: Asset Index Computation
Principal Component Analysis (PCA) is used to compute asset index for each household. PCA is a multivariate statistical technique which converts a set of possibly correlated variables into a set of uncorrelated variables called principal components. Each component is a linear combination of all the predictor variables. The first component captures maximum information from the original data set and each additional component records lesser information than the previous one. We convert our predictor variables of appliance ownership and households characteristics into principal components using PCA. We then select significantly relevant components based on certain statistical tests. These components are used to compute Asset Index for each household. Asset Index is computed separately for each state. The index is then used to divide each state sample into tertiles which correspond to low, medium, and high income levels. The ownership of different appliances and fuels used for different end-uses across these income categories is shown below.
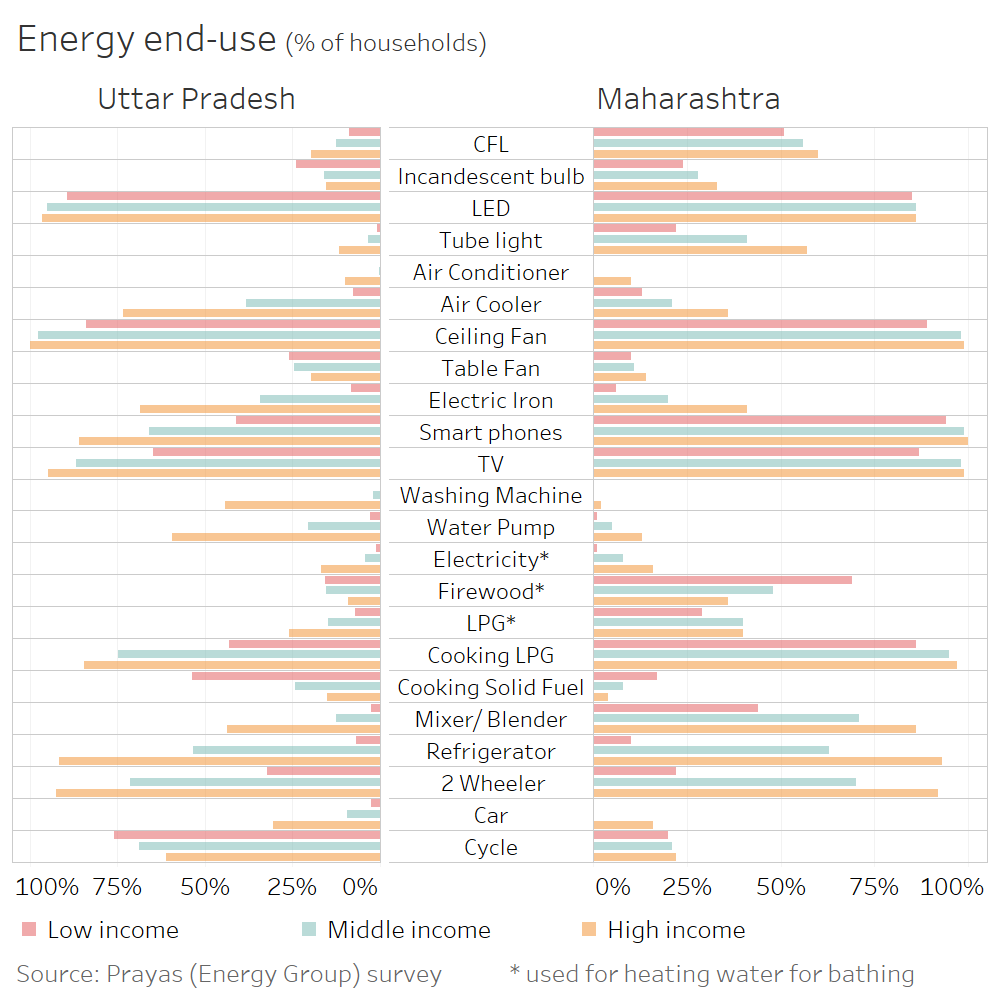
Figure 4: Appliance ownership across different income levels
Please contact Aditya Chunekar (