This is the sixth post in the blog series “Plugging in: Electricity consumption in Indian Homes” by Prayas (Energy Group) and Centre for Policy Research (CPR).
The large number of affordable homes to be built in the next few years has spurred the interest of cities, real estate developers, technology providers, amongst others. From an energy perspective, the unbuilt homes provide an important advantage. Because the bulk of low-income housing is yet to be constructed, the type of construction undertaken, the appliances they are designed for, and how they expend energy to cool and heat will shape the electricity consumption trajectories through the multi-decade lifetimes of these buildings. More so, new housing provides a physical setting for shaping preferences and practices around appliance purchase and electricity consumption that once set are not easily reversed. In this piece, we examine the energy services demanded within affordable housing, and identify which appliances households buy as their ability to consume increases.
We conducted a survey in 2017 in low-income houses in Rajkot, Gujarat to understand their electricity use patterns and the underlying drivers. This is part of our ongoing study on energy use in low-income urban households under the CapaCITIES project. Lighting, fans, televisions and fridges form majority of the appliance compositions in the affordable housing blocks.
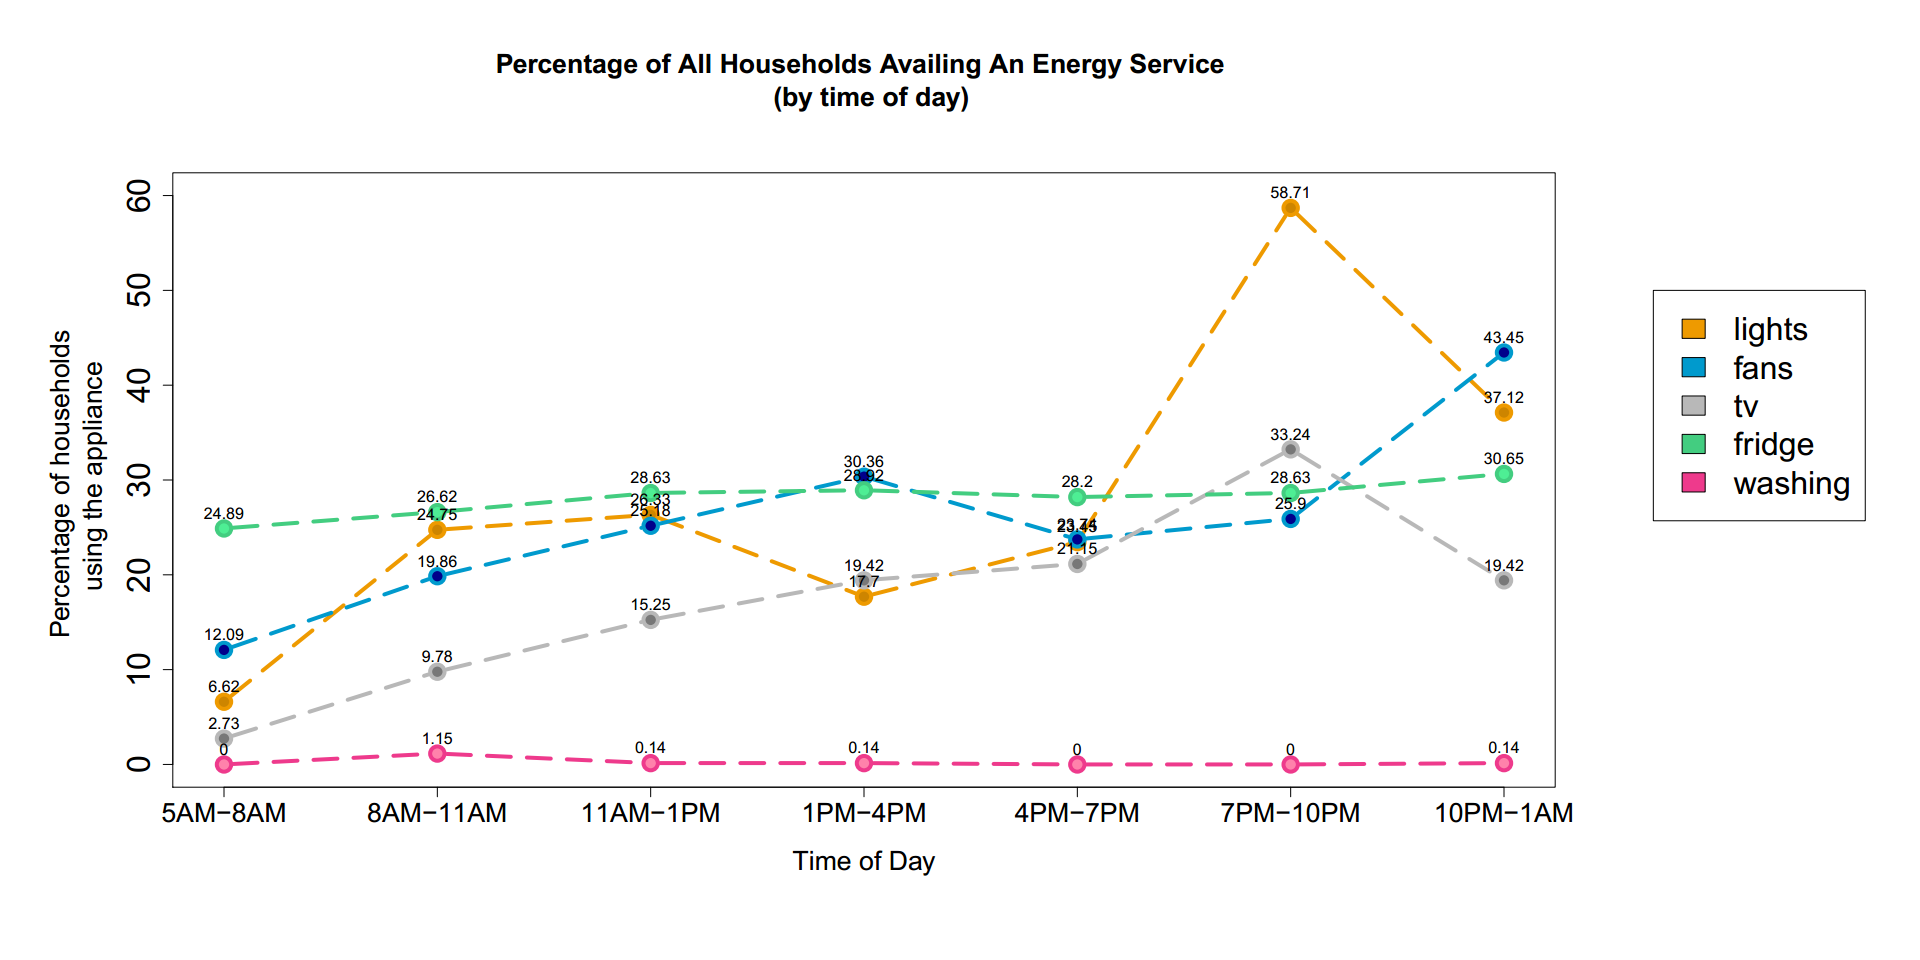
Households use the services provided by these appliances most in the evening between 7-10 p.m., with usage of lighting and TV dominating. As shown in Figure 1, 59% of all households reported they used lighting in the previous evening and 33% of households watched television in that time slot. Fan usage peaked during the night, whereas a small number of fridges, on the other hand, were switched off during the night to save on the electricity bill.
These numbers indicate that not all households use lights in the evening, turn on fans while sleeping or always keep the fridge on. In discussions, some residents indicated that their work did not allow a ‘9 to 5’ schedule where they spent the evening at home; others said they did not turn on lights as the street and hallway lights were enough to illuminate the homes.

Figure 1: Proportion of households availing energy services by time of day
Source: Rajkot affordable housing energy survey (Khosla et al., in preparation)
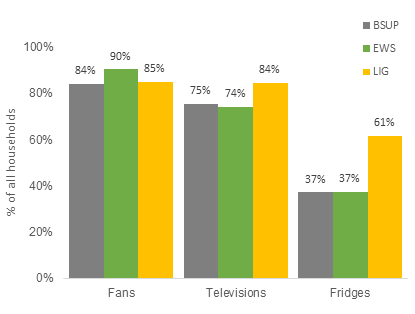
To understand appliance use better, we categorised results according to the three types of government affordable housing: BSUP or Basic Services for the Urban Poor (built 2007 onwards); EWS or Economically Weaker Sections; and LIG or Low Income Groups housing (EWS and LIG are built under the Housing for All programme, 2015 onwards) (Figure 2). The categories broadly correlate to income – BSUP residents, on average, being the poorest in the sample, and LIG, the best off.
We find that fans are the most owned appliances across housing types, followed closely by televisions. Even in the lowest income BSUP homes, the rates of TV penetration are not dramatically different from the rates in higher income EWS and LIG homes. The difference in rates of appliance ownership between the three categories are most pronounced in fridges, where the LIG homes have the most fridges.

Figure 2: Appliance penetration rates in the affordable housing sample
Source: Rajkot affordable housing energy survey (Khosla et al., in preparation)
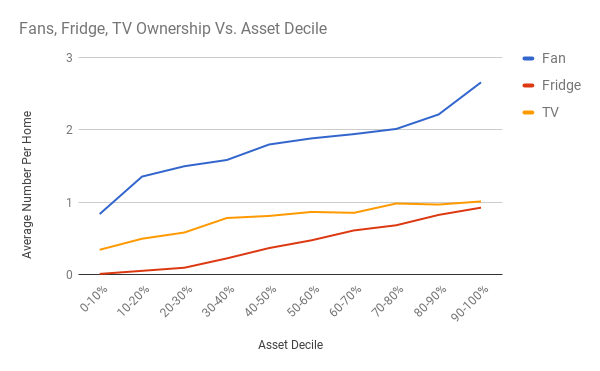
This trend is corroborated in Figure 3 which maps appliance ownership with a household’s overall assets or ability to consume, as measured by an asset index. Most homes, even in the early deciles of the asset index, own a fan, and this number increases to two fans or even more as a household’s assets increase. Fan ownership is followed by a TV, and the probability of owning a TV is quite high even though households may not own many other assets. TVs are more ubiquitous than coolers and fridges, in spite of the hot and dry climate and peak summer temperatures of the region. This result aligns with the literature that shows that over the past few decades, TV viewing has become the most important information and entertainment activities for middle class and increasingly for lower-income families. Fridges, on the other hand, follow a more conventional pattern where their ownership rises gradually as households get wealthier (with an increased probability of ownership around the 9th and 10th decile of the asset index).

Figure 3: Appliance ownership across the consumption asset index for the affordable housing sample
Source: Rajkot affordable housing energy survey (Khosla et al., in preparation)
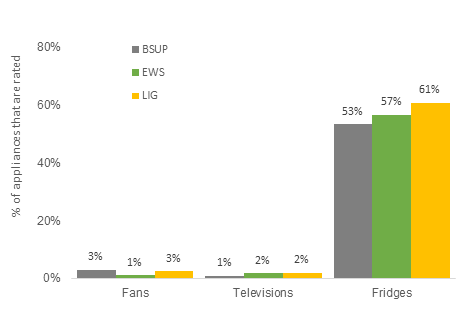
It is clear that fans, televisions and fridges, form the bulk of appliances used within affordable housing units. These appliances, once bought, likely persist in households for a decade if not more, and can often then be passed on, second-hand, to other families. Further, because of the immense transition to affordable housing units that is ahead for India, the number of appliances, which will be bought for the first time is significant. As discussed in the previous piece of this series, appliances drive electricity consumption in homes and the adoption of energy efficient, or star rated, appliance models can significantly reduce this electricity use. We take a further look at the appliances used in the affordable housing sample to examine the number of appliances that are star-rated (Figure 4).

Figure 4: Percentage of star-rated appliance owned in the affordable housing sample
Source: Rajkot affordable housing energy survey (Khosla et al., in preparation)
Two striking insights emerge from Figure 4. First, while fans and TVs are by far the most ubiquitous appliances used within affordable housing, the number of rated appliances within these categories is minimal. Appliance shops in the vicinity of the affordable housing blocks corroborated that consumers had little awareness of energy savings from efficient fan and TVs, and that rated versions were only now entering the market. This presents a significant opportunity for scaling up the standards and ratings programme for fans and televisions, the energy savings from which are dramatic.
Second, the ratings programme for fridges is much more effective, as seen across the affordable housing types. Part of the reason for this is that BEE (Bureau of Energy Efficiency) has mandatory and stringent standards for frost-free refrigerators (as opposed to a voluntary labeling for ceiling fans). In all cases, there is large scope for increasing the efficiency of appliances through a rigorous ratcheting up of standards and labels. Compared to the lack of consumer awareness of TV and fan ratings, shop attendants indicated that consumers were aware of fridge ratings, often asked for input on savings, and were wary of costs of running energy intensive fridges. This is also seen in the data by a proportion of households that turn off their fridges at night to save costs.
As more formalised housing and rising incomes set to increase the use of energy intensive appliances, their usage patterns suggest the enormous scope for this transition to be an energy efficient one. In the next post of this series, we continue to examine energy intensive appliances, with a view from the National Capital Region, which has the highest residential electricity consumption in the country.
This piece is authored by Radhika Khosla and Ankit Bhardwaj at the Centre for Policy Research, New Delhi.
This blog series is also available on the Centre for Policy Research website.

