
Insights from smart metering data
eMARC is an initiative by Prayas (Energy Group) to provide insights on electricity consumption in Indian homes. Under eMARC, minute-wise data related to electricity consumption is collected using smart meters from a sample of households and appliances. Interactive dashboards based on the analysis of this data are available on the eMARC website. In this blog series we present key observations based on the data collected from 115 households from January 2018 to June 2020. The households include urban households from Pune City and semi-urban and rural households from the districts of Pune, Aurangabad, Kanpur Rural, and Gonda. In this post we present the insights on the electricity consumption patterns of the sample households.
Please read this post for details on how emarc works and the description of our sample.
Key takeaways
- On an average, the household electricity consumption is about 156 kWh per month in Pune city, 133 kWh in Pune district, 184 kWh in Aurangabad, 115 kWh in Kanpur, and 205 kWh in Gonda.
- There is significant variation in electricity consumption across the households within each region. Variation in electricity consumption is also observed across consumers owning a particular appliance like air-conditioner or water-heater.
- About 81% of all the households in the sample fall under the 5 star category as per the residential energy conservation building codes (Eco-Niwas Samhita).
Electricity consumption per minute was recorded by the eMARC meters for all the sample households. We used these minute-wise values to compute daily, monthly, and annual electricity consumption of a household. A threshold of 80% data availability has been applied for the calculations. The electricity consumption varies significantly both within and across the regions. We have categorized households as those owning air-conditioners (ACs), those owning water heaters but no ACs and rest as basic. Distribution of the sample across these categories is shown in Table 1. The electricity consumption also varies within and across these categories.
| Region | Basic | Water Heaters but no AC | With Air Conditioners | Total |
| Pune city | 11 | 15 | 13 | 39 |
| Pune | 20 | 4 | 24 | |
| Aurangabad | 21 | 4 | 2 | 27 |
| Gonda | 6 | 2 | 8 | |
| Kanpur rural | 9 | 9 | ||
| Total | 67 | 21 | 19 | 107 |
Table 1: Distribution of households across types
Consumption patterns variation across households
The average monthly electricity consumption of households across regions and household categories based on appliance ownership is plotted in Figure 1. The monthly consumption averages are between 100 and 200 kWh. However, significant variation from the average is observed across the households. In Pune city, the average monthly consumption varies from 60 kWh for a basic household to about 348 kWh for a household which uses air-conditioners or water-heaters. A few households in each of Aurangabad, Kanpur, and Gonda districts consume substantially higher electricity which has increased the average of these districts. We will discuss them more in the post on the individual households.

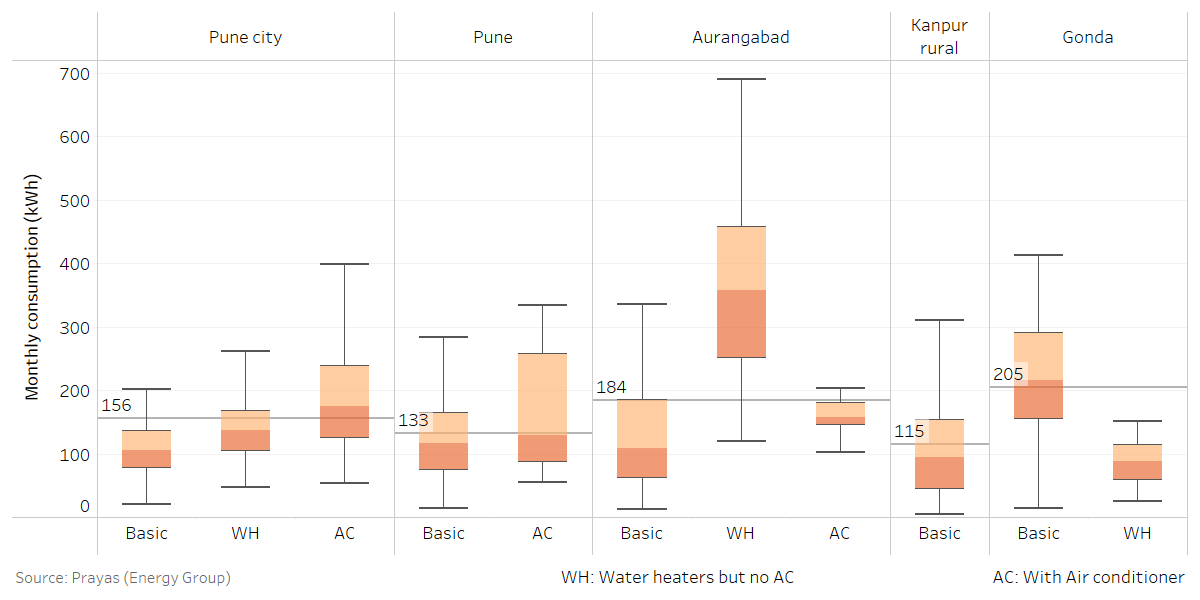
Figure 1: Average monthly electricity consumption across regions and appliance categories
Households from our sample in Pune city are smaller (about 3.8 members per household) as compared to those in the semi-urban and rural areas. The average household size is about 5.3 in Pune district and 5.7 in Aurangabad whereas the size is about 6.5 in Kanpur rural and 8.3 in Gonda. On a per-capita basis, the households with water-heaters in Aurangabad consume the highest followed by households with ACs in Pune city (see Figure 2). The per capita annual residential consumption as reported by the Central Electricity Authority (CEA) in the 19th Electric Power Survey (EPS) is 260 kWh in Maharashtra and 165 kWh in Uttar Pradesh.

Figure 2: Annual per capita electricity consumption across regions and appliance categories
Seasonal Variation
Summers are hot in all the regions in our sample with maximum daily temperatures regularly exceeding 35°C. Use of space cooling appliances is common across regions. In the survey that accompanied the installations, all the eMARC households reported using ceiling fans, followed by some using air coolers, and a few using air conditioners (AC). Use of These appliances result in higher electricity consumption in summer as can be seen in Figure 3. Households with AC in Pune city consume about 1.3 times electricity of their average in the summer months. We have examined the relation between temperature and electricity consumption in the sample households in greater detail here. Although winters are harsh in some of the regions of our sample space-heating appliances are rarely owned and used thus electricity consumption in winter months is lower than in summer in most cases. In some households, the consumption in winter months increases due to the use of water heaters.
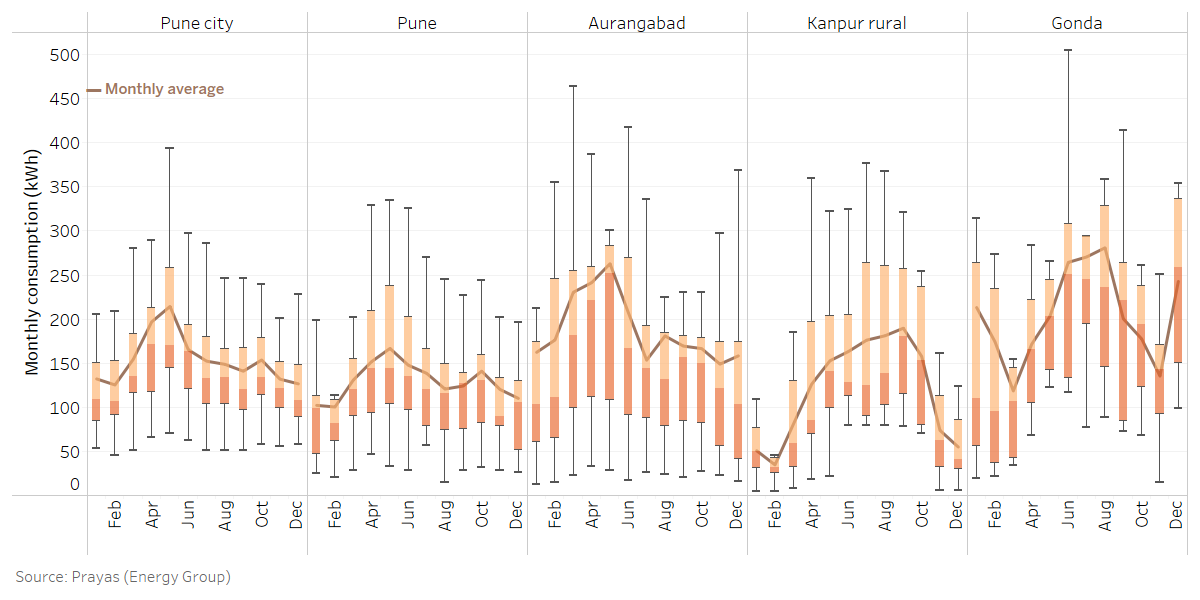
Figure 3: Seasonal variation in average monthly electricity consumption
Energy Performance Index (EPI)
The Energy Performance Index (EPI) is the annual electricity consumption per square meter built-up area for a dwelling unit. The Residential Building Energy Labeling Programme by the Bureau of Energy Efficiency (BEE) rates residential buildings based on their EPI. The households are rated from 1 star to 5 star depending on their EPI, 1 star being the least energy efficient (i.e. high value EPI). The cut-off values of EPI for star ratings are dependent on the climatic zone of the household. Pune city and the entire Pune district lie in warm-humid zone while Aurangabad lies in Hot-Dry zone, and Gonda and Kanpur lie in composite zone. The average EPI for sample households in Pune city is about 26.3 kWh/sq.mt. About 81% of the households fall under the 5-star category. As can be seen in Figure 4, the annual electricity consumption of 5-star households varies between 121 kWh to 4174 kWh. Hence, a larger household (based on area) may be energy efficient but still consume significant amounts of electricity. BEE's star rating schedule for buildings also assumes that 25% of the area of the house is air conditioned which may be the reason why most of the households in our sample fall under the 5 star category.
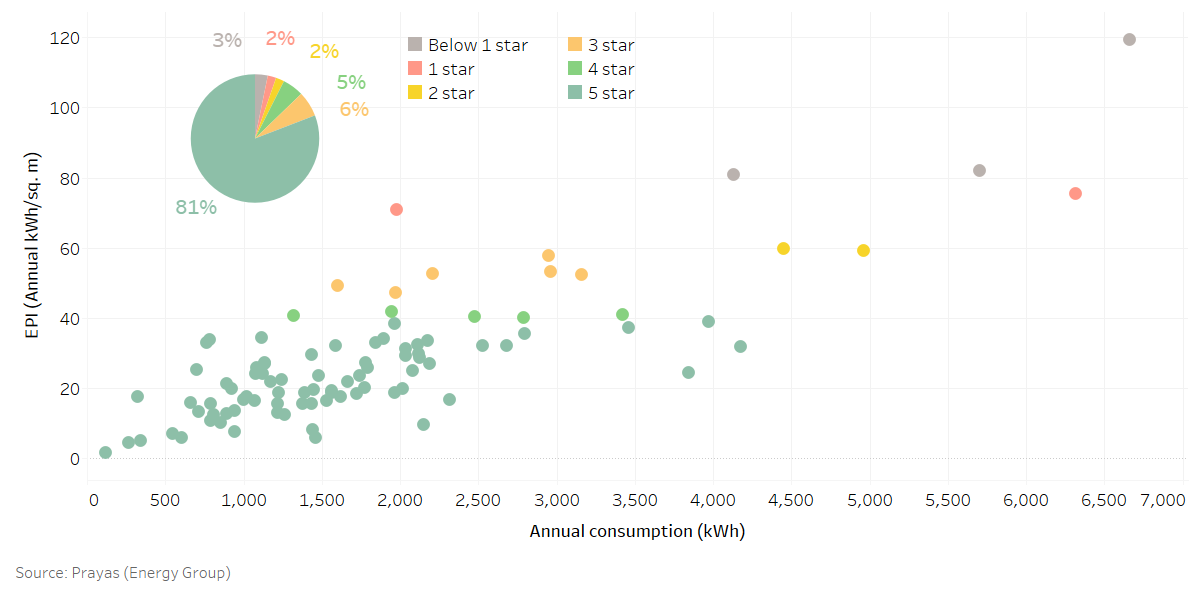
Figure 4: Energy Performance Index (EPI) Vs Annual Consumption
To conclude, there is limited information available on actual electricity consumption of households in India. This data shows that there is significant variation in consumption within and across different regions/districts, which is impacted by the household size, weather patterns and appliance ownership. The average monthly electricity consumption of all the households varies between 100 kWh and 200 kWh in the sample but there is significant heterogeneity. The actual electricity consumption patterns can play a key role in forecasting future demand which in turn can be crucial for the DISCOM's power procurement and distribution infrastructure planning.
Contributors: Aditya Chunekar, Abhiram Sahasrabudhe, Shweta Kulkarni
Please contact Aditya Chunekar (
Suggested Citation: Prayas (Energy Group), ‘Electricity Consumption Patterns’, part of blog-series on smart meter data collected under the eMARC initiative, July 2021.
Please click here to read the other posts in this series.