
Insights from smart metering data
eMARC is an initiative by Prayas (Energy Group) to provide insights on electricity consumption in Indian homes. Under eMARC, minute-wise data related to electricity consumption is collected using smart meters from a sample of households and appliances. Interactive dashboards based on the analysis of this data are available on the eMARC website. In this blog series we present key observations based on the data collected from 115 households from January 2018 to June 2020. The households include urban households from Pune City and semi-urban and rural households from the districts of Pune, Aurangabad, Kanpur Rural, and Gonda. In this post we present the insights on the electricity load patterns of the sample households.
Please read this post for details on how emarc works and the description of our sample.
Key takeaways
- The peak morning load of the sample in Pune city for the entire year occurs at around 9 am in January and is about 350 W per household. In the case of households with water-heaters this is about 500 W per household.
- The peak night time load of the sample in Pune city for the entire year occurs at around 12 am in May and is about 350 W per household. In the case of households with air-conditioners this is about 600 W per household.
- The households in Pune and Aurangabad districts share some similarities in load patterns with the households in Pune city. One clear distinction is that the morning peak occurs much early at around 7 am. It is about 300 W in Pune district and 550 W in Aurangabad district.
- The households in Gonda and Kanpur district exhibit a completely different load pattern. It is significantly impacted by the power-cuts which vary across locations in time and duration. One clear feature is absence of morning or evening peaks observed in Maharashtra.
Electricity load patterns provide insights on the time and quantum of use of electricity. This is particularly important for an electricity distribution company (DISCOM) to plan the procurement of electricity so that they can meet the demand at all the times and also plan the distribution infrastructure. The eMARC meters recorded the active load (in kW) for the whole house every minute as well as for the refrigerator wherever present. We use load values averaged over a block of 15 minutes for the present analysis. We chose a 15 minute block as most of the scheduling decisions of the DISCOM happen at that resolution.
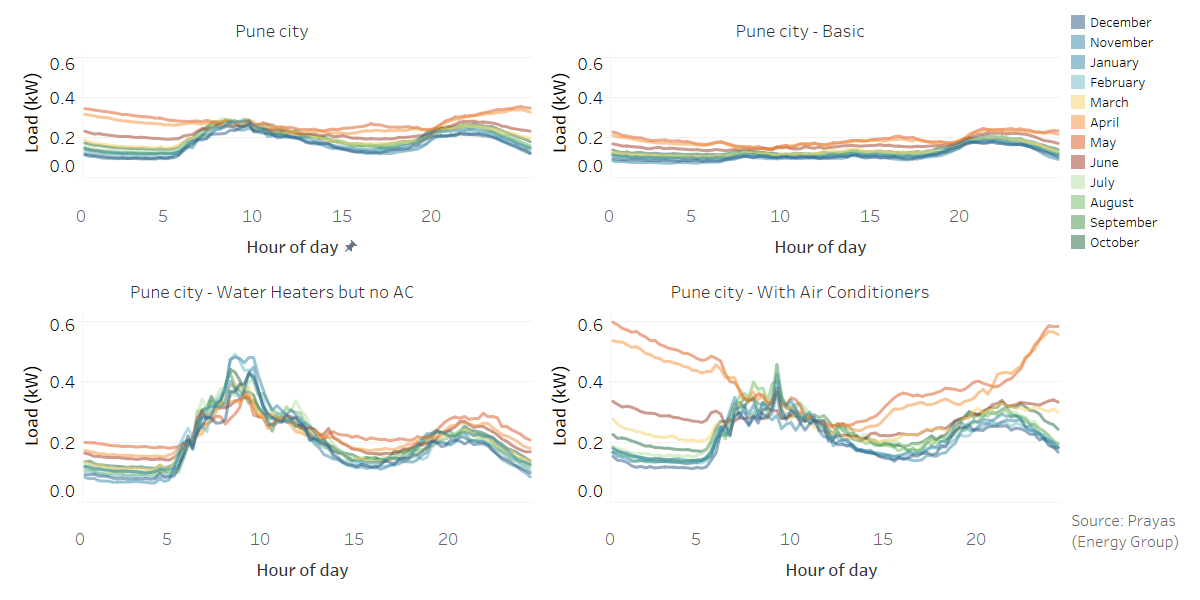
Figure 1: Daily load curves averaged over month in Pune city
Figure 1 shows the average monthly load curves for the entire sample in Pune city as well as for different categories based on appliance ownership. As expected, there is a significant seasonal variation in the load curves. The night time average load varies between 100 to 150 W per household in the non-summer months. This increases in the summer months with the peak being about 350 W per household at around 12 am - 1 am in May. In households with air-conditioners, this peak is about 600 W per household after accounting for the fact that not all ACs are on all the time. In households with air-conditioners, the night-time summer load tapers down after 1 am as the AC load goes down with the pre-set timers and thermostats getting activated in the early morning with reduction in outdoor temperatures. The morning peak load starts ramping up at about 5 am and peaks at around 9 am. This is observed throughout the year but is more pronounced in the non-summer months. Most of it is due to the electric water-heaters. The peak morning demand of the entire year is about 350 W per household at around 9 am in January. For households with water-heaters, the peak is about 500 W per household. The evening peak occurs at around 9 pm and varies between 200 to 250 W per household in the non-summer months. The peak usually starts building around 6 pm, when people return home from their offices and also switch-on lighting and other devices. The load curves change in summer with the loads building up from 1 pm with people in the house during daytime switching on space cooling appliances. Load curves also change based on the day of the week. On weekends, as can be seen in Figure 2, the morning load curve ramp-up as well as ramp-down is gradual. Load in day hours is higher on weekends, when more people are likely to be home. There is no significant difference in night time load.
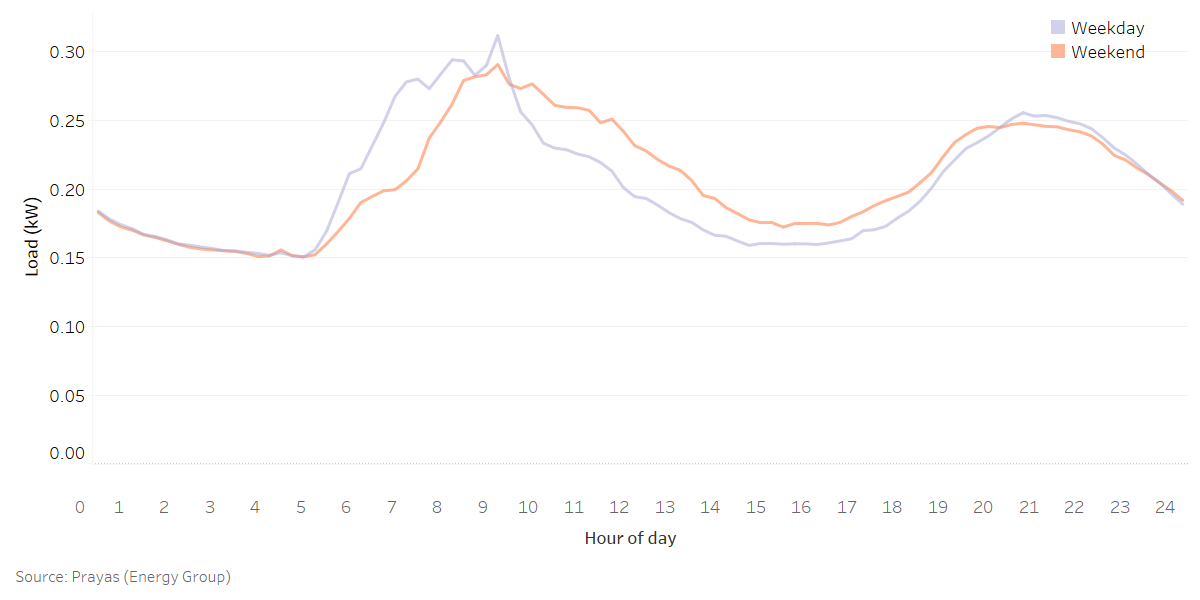
Figure 2: Load curves for weekdays and weekends in Pune city
Figure 3 shows the load curves of the households in the semi-urban and rural areas of Pune and Aurangabad districts in the sample. They share some patterns with the households from Pune City such as the distinct morning and evening peaks. However, there are some distinct features of these load curves. The range of the night-time loads is about 75 W in winter to about 200 W in summer per household for Pune district and 100 to 250 W for Auranagabad district. The summers are usually hotter in Aurangabad. The morning load starts early between 4-5 am and also peaks early at around 7 am. The morning peak has also been observed in the households in the basic category. Our preliminary observations indicate that this may be due to two reasons: one, use of immersion rods to heat water (which households did not classify as water heaters) and second use of water pumps in the morning. We plan to investigate this more.
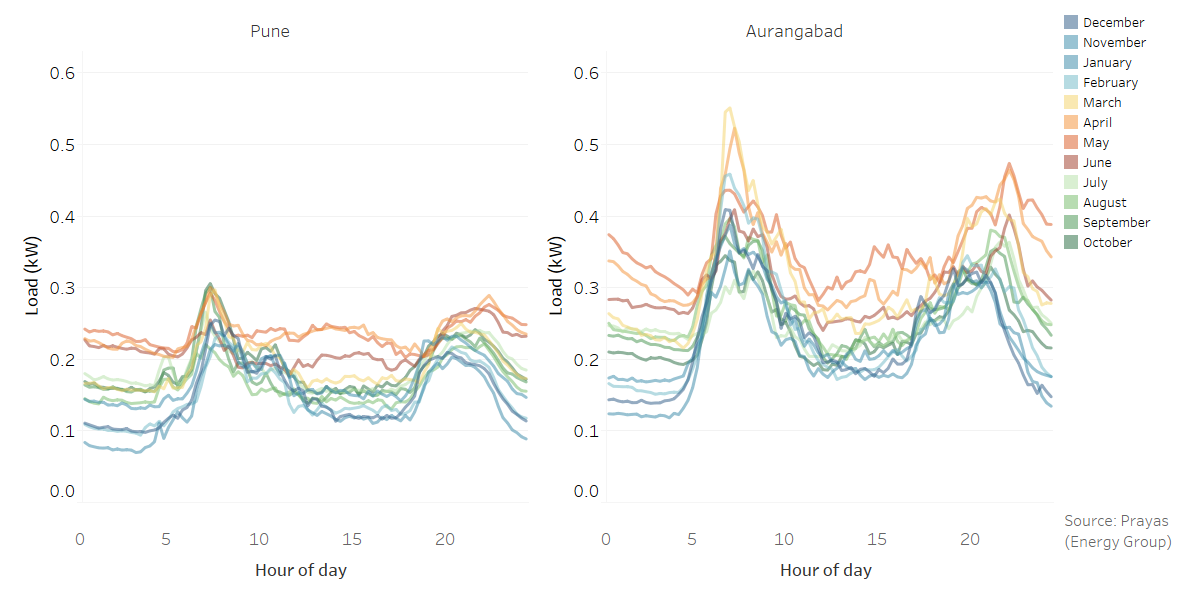
Figure 3: Daily load curves averaged over month in Pune and Aurangabad districts
Figure 4 shows the average monthly load curves for the households in the semi-urban and rural areas of Gonda and Kanpur Rural districts. They look significantly different from each other as well as from those in Maharashtra. One point to note is that these households face higher power-cuts compared to those in the sample from Maharashtra. These power-cuts are spread throughout the day and the time and the duration are different for different households based on their location. This can possibly distort the average load curve for the sample. With this limitation, we make a few observations. The prominent morning peak is missing in both the districts. This can be attributed to the low ownership and use of electric water heaters in these households. The average night-time loads vary between 150 W in winter to about 450 W in summer in Gonda, and from 60 W to about 350 W in Kanpur rural. The increase of about 300 W can be attributed to the ceiling fans and air-coolers used in summer.
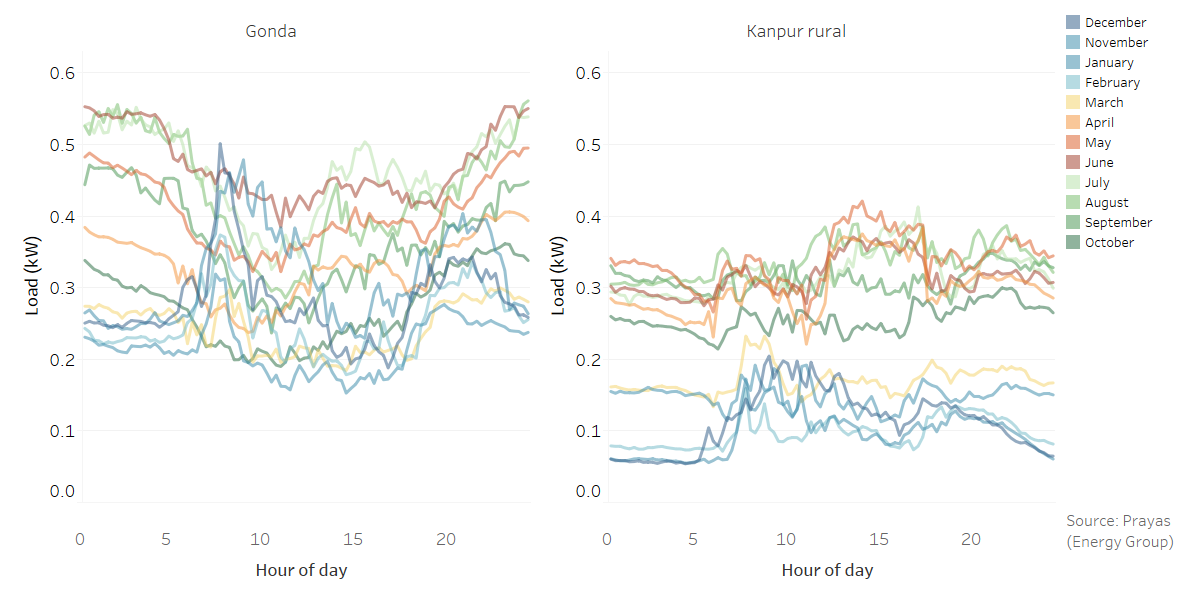
Figure 4: Daily load curves averaged over month in Gonda and Kanpur rural Districts
To conclude, load data recorded by a smart meter presents a much more detailed picture of the electricity consumption patterns of the households. The data can be used to identify households with higher loads during the system peak times and targeted with demand side management programmes in the future. This data can also be used to assess the impact of time-of-use tariffs on the household's electricity bills and give a better idea of their response.
Contributors: Aditya Chunekar, Abhiram Sahasrabudhe, Shweta Kulkarni
Please contact Aditya Chunekar (
Suggested Citation: Prayas (Energy Group), 'Electricity Load Patterns', part of blog-series on smart meter data collected under the eMARC initiative, July 2021.
Please click here to read the other posts in this series.