We discuss the insights from analysis of data from Electricity Supply Monitoring Initiative (ESMI) in the Indian state of Uttar Pradesh in this post. ESMI is an effort by Prayas (Energy Group) since 2015, to provide evidence based feedback about the quality of supply to all stakeholders in the electricity sector. Under ESMI, specially designed IoT enabled voltage monitors are deployed at several consumer locations across India to develop a reliable database on supply interruptions and voltage levels. The minute-wise voltage data collected through ESMI is available in the public domain on watchyourpower.org and the Harvard Dataverse.
Uttar Pradesh, India’s most populous state was home to about 22 crore people, almost a quarter of them urban residents as per projections for 2018. In 2017-18, the households in Uttar Pradesh monthly per capita expenditure was around ₹2000 in Rural areas and around ₹4400 in the urban areas1. More than 98% villages in the state were electrified by 2014. The state had 100% of the willing households i.e., 2.9 crore households electrified by 2019. However, questions around reliability and use of electricity to improve quality of life remain.
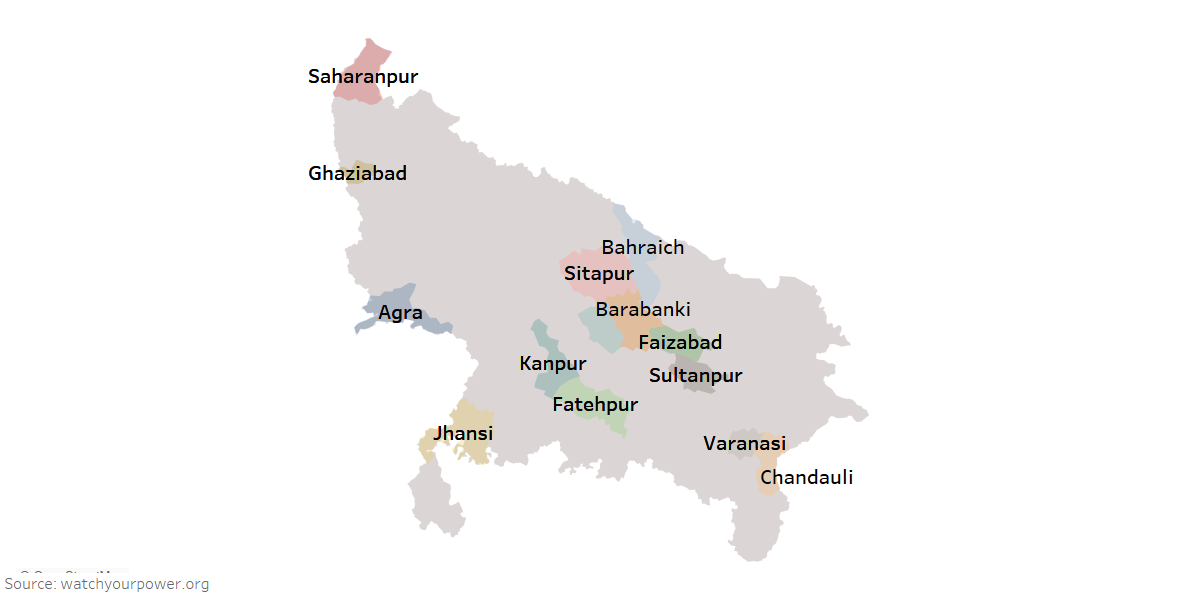
Figure 1: Districts in Uttar Pradesh monitored under ESMI
Overview of deployments
Under ESMI, about 160 rural and urban locations in Uttar Pradesh were monitored in total over the years 2016-19, spread across 14 districts shown in the map above. These locations were further categorized into domestic and non-domestic connections. The distribution of the locations is not similar across urban and rural locations and also across the state geography and hence may not be fully representative of the district or state.
Table 1: Type of locations monitored under ESMI
| Location type | Connection type | Total locations | |
| Domestic | Non domestic | ||
| Megacity | 9 | 7 | 16 |
| Other municipal area | 57 | 11 | 68 |
| Rural | 79 | 79 | |
| Total locations | 145 | 18 | 163 |
Analysis
Minute-wise voltage data recorded at ESMI locations in Uttar Pradesh in the calendar years 2016-19 was used for the analysis presented here. Data from a location was considered for months only where more than 90% of data was available. The number and duration of outages were analyzed to gauge the quality of supply. The occurrence of outages was additionally analyzed for patterns across times of the day. Later in the post, we discuss a few case stories which further share insights about quality of supply at some of the locations.
Hours of outage
Electricity supply outages were observed to be a common occurrence in all the locations across Uttar Pradesh. The extent of the outages however, varied greatly both in duration and frequency. On an average, the megacity locations experienced 21 minutes of daily outage, while that was about 90 minutes for locations in other municipal areas. Rural areas on the other hand, faced outages for in excess of 4 hours (>240 minutes) a day.
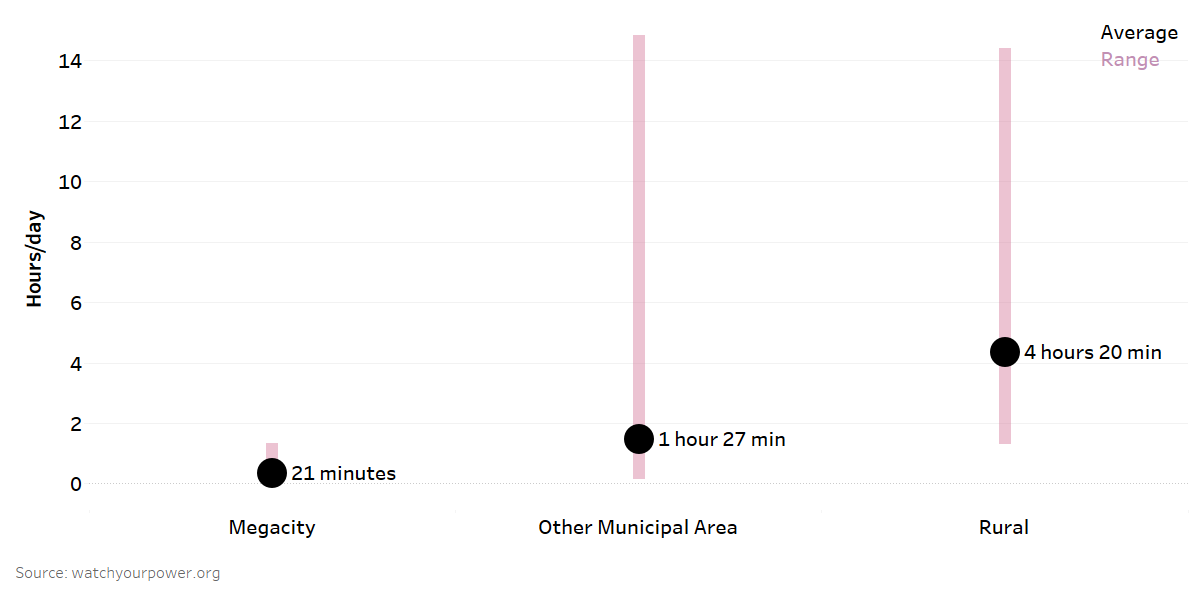
Figure 2: Daily hours of outage averaged from 2016 to 2019
A comparison of ESMI data from four districts in Uttar Pradesh with the data reported on the URJA app (not functional any more) shows wide disparity between the number of interruptions and duration of outages as shown in the figure 3.
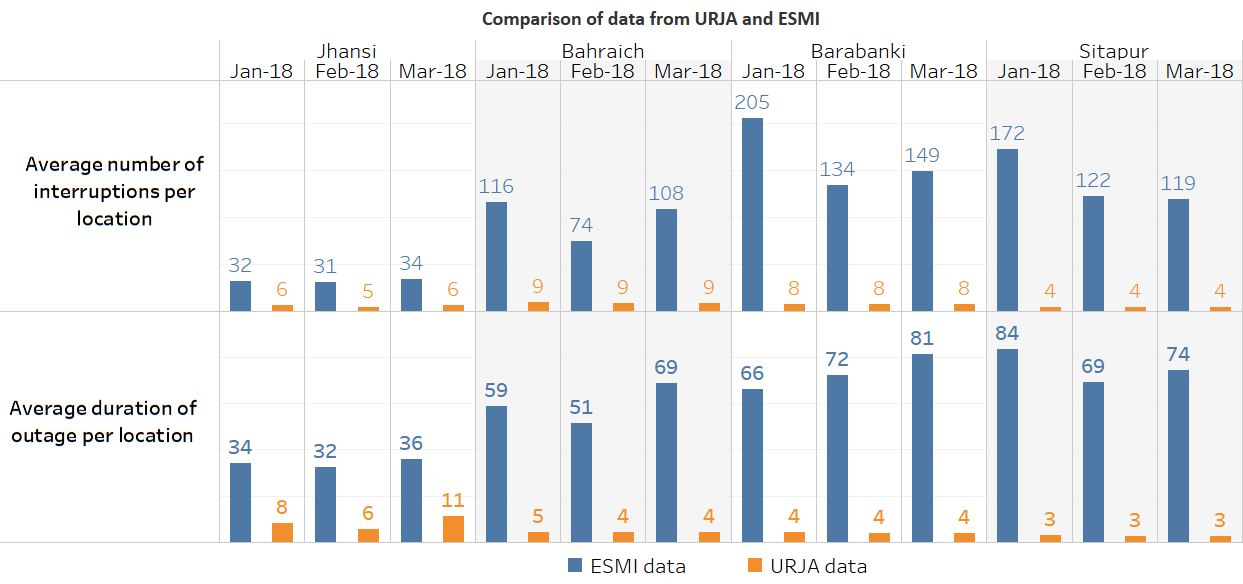
Figure 3: Comparison of data from URJA and ESMI for districts in Uttar Pradesh
The daily supply profile chart shows the nature and variations in the outages experienced at these locations.
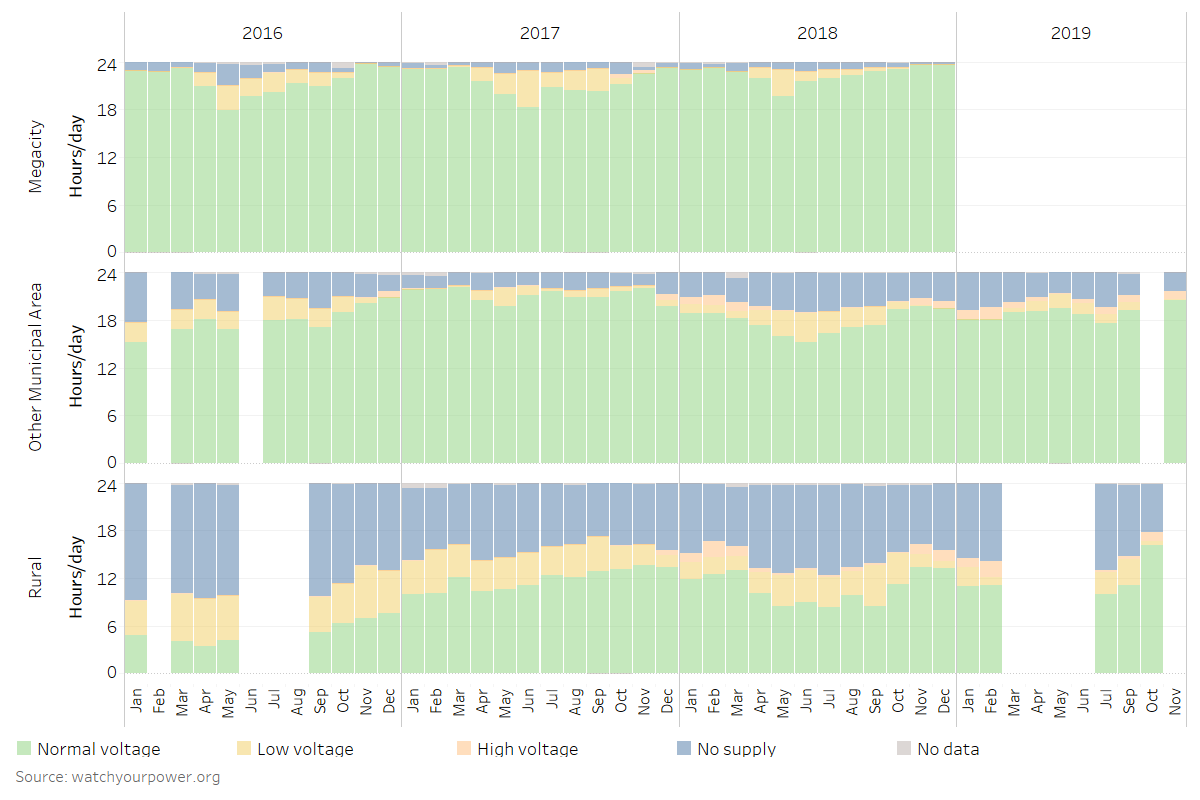
Figure 4: Daily electricity supply profile for the state of Uttar Pradesh
Nature of outages
About 37% of the outages faced at ESMI locations in Uttar Pradesh were longer than three hours each, and another 33% outages ranged between one - three hours long each. The rest was contributed by shorter (<1 hour) duration outages. Numerous short interruptions lead to frequent disruptions and hence reduce the reliability, and in turn reliability of the power supply. The figure 5 shows the duration-wise breakup of outages across all ESMI locations in Uttar Pradesh, each location depending on region, proximity to urban centers show a different nature of breakup.
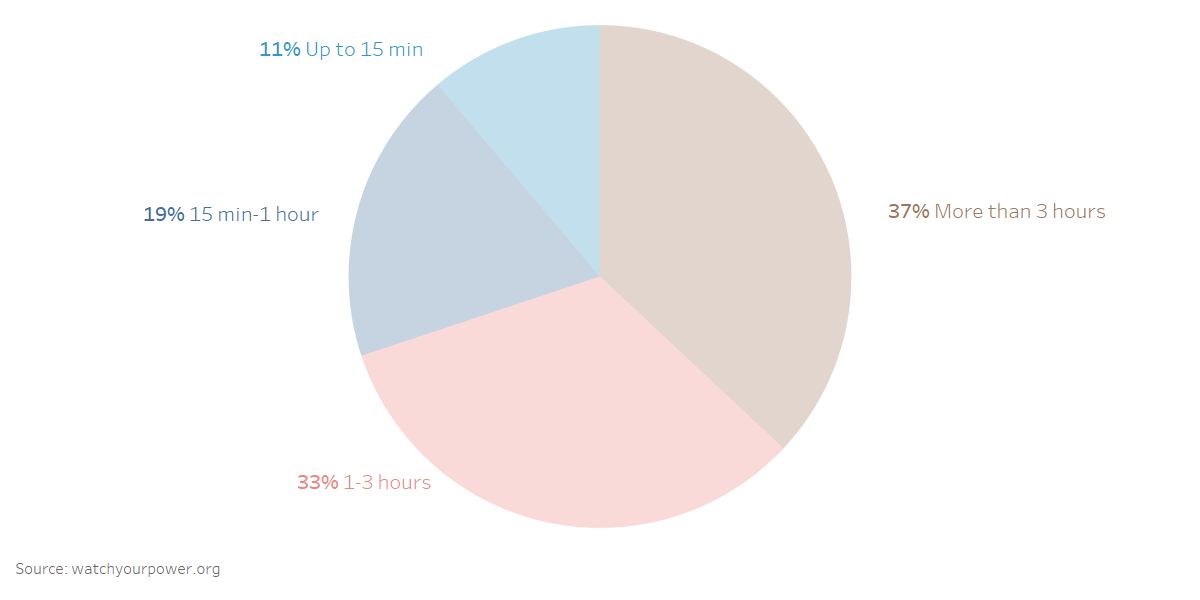
Figure 5: Duration-wise breakup of outages across all ESMI locations in Uttar Pradesh
Apart from duration, the frequency of outages also plays a crucial role in determining the reliability of supply. The megacity locations in Uttar Pradesh faced a couple of outages a day on an average, those in other municipal areas experienced nearly five outages a day while rural locations experienced up to 10 outages a day. The number of outages slightly increases by the end of summer, and is the lowest in winter months.
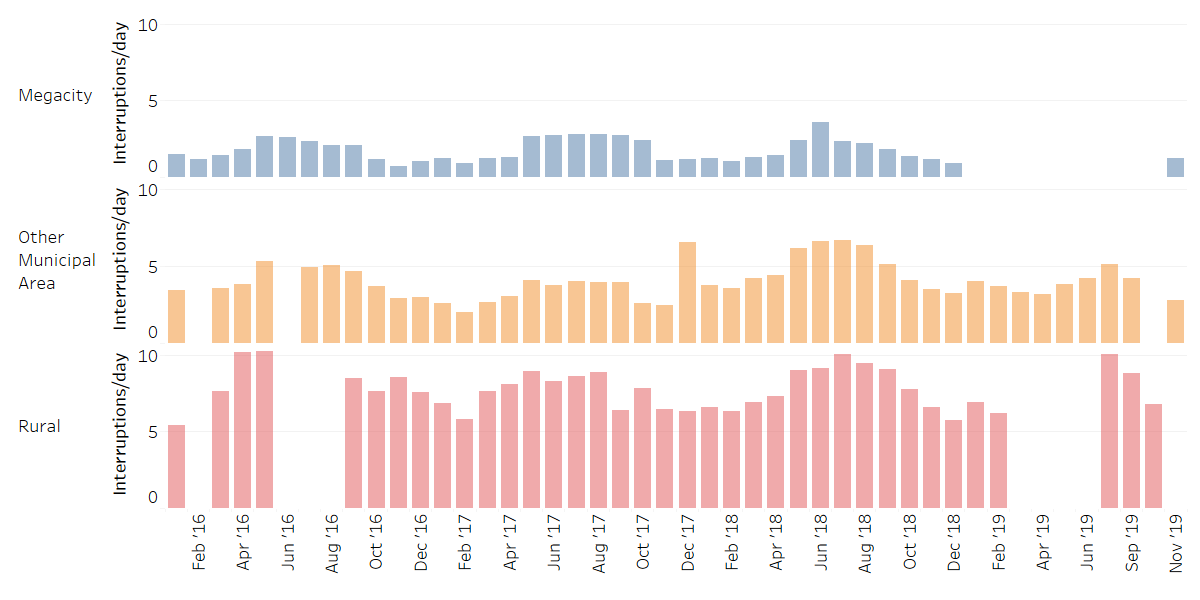
Figure 6: Average daily number of interruptions
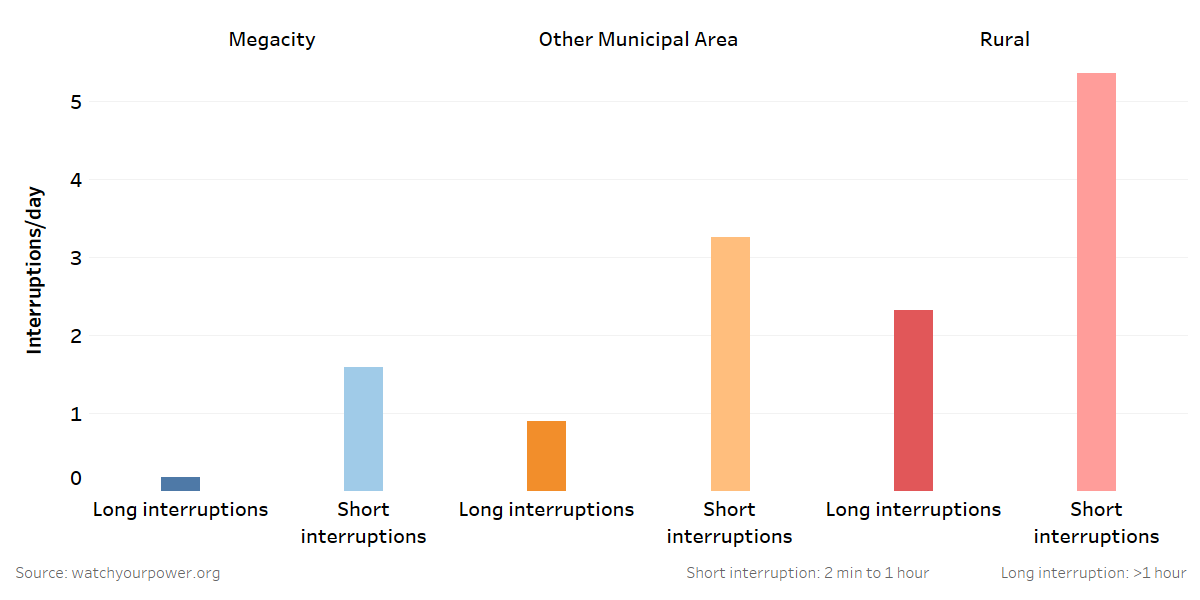
Figure 7: Breakup of daily interruptions
Similar to the duration and number of electricity supply outages, the time of the day when the outages are experienced have a significant effect on making meaningful use of the electricity supply. It was observed that most of the outages experienced at ESMI locations are during the day. Especially most rural areas experienced a high number of outages during the day.
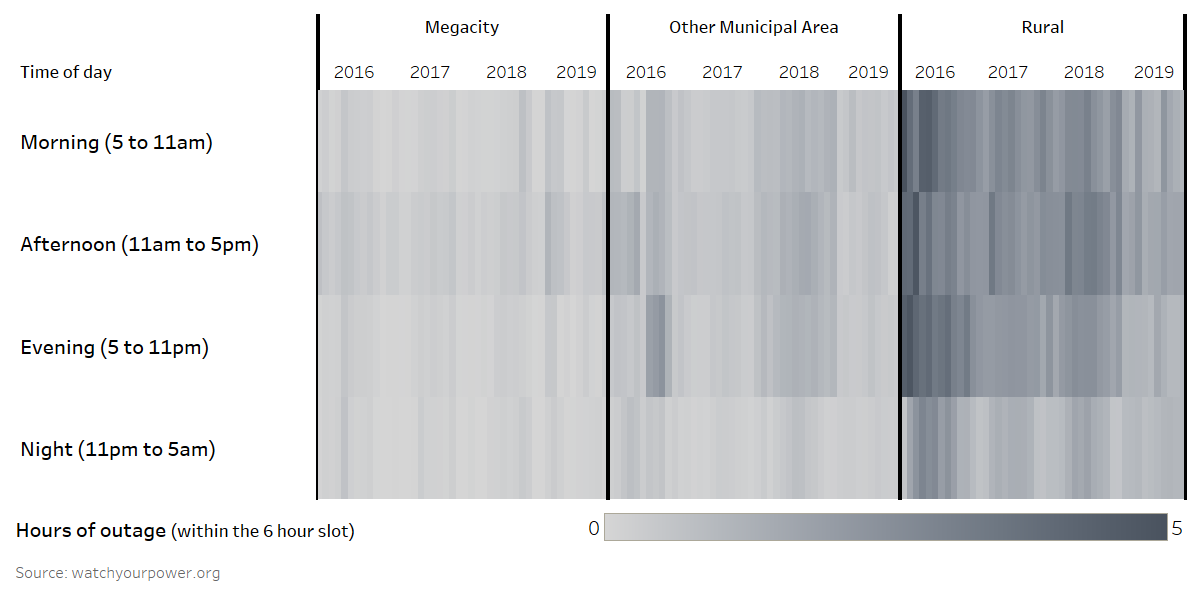
Figure 8: Hours of outage across time of day
Evening hours of supply
Another important aspect of the time of outages is the availability of supply in the evening hours. Long hours of outages during evening hours prevent households from using electricity for even basic uses of electricity such as lighting. Unavailability of electricity in evening hours forces consumers to use expensive battery backup or options like kerosene /oil lamps which pose health and safety risks.
It is observed that even in a megacity locations, Lucknow in Uttar Pradesh did not receive the entire six hours of evening supply between 5 and 11pm, and faced 12 minutes of outage on an average every day. This increased to about 53 minutes at locations in the other municipal areas and close to 1 hour and 30 minutes of daily outage in rural areas during the six evening hours.
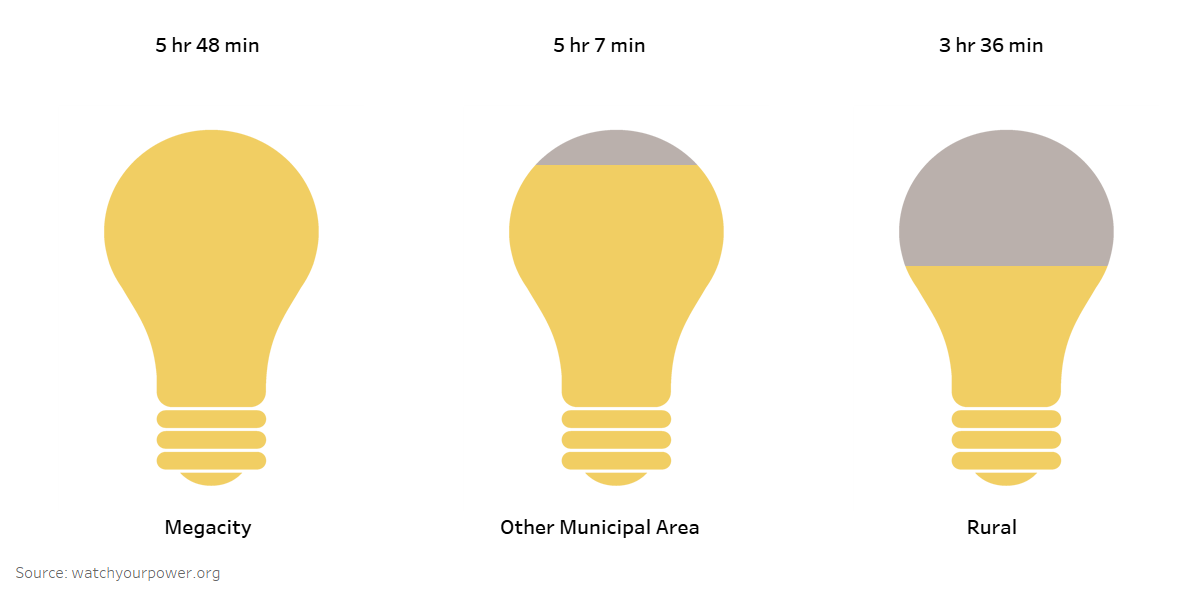
Figure 9: Daily evening hours of supply
Supply Quality at different locations
The overall supply quality parameters show that in the state of Uttar Pradesh between 2016-2019 supply in rural areas and other municipal locations has been much worse in comparison to megacities. A few particular cases detailed here try to explain some of the causes leading to such poor quality of supply.
Sikanderabad
Sikanderabad a village in Sitapur district, is located about 40 km from the state capital Lucknow. This location had recorded around 12 hours of high voltage (>270 volts) supply each day in the initial month of monitoring under ESMI. Interestingly over the next few months ESMI recorded improvement in the voltage supply quality at the location. It can however be seen from the supply profile graphic below, that although there was improvement in quality of the supply, the outages of nearly 6 hours each day remained consistent. Monitoring at Sikanderabad was discontinued after July 2018.
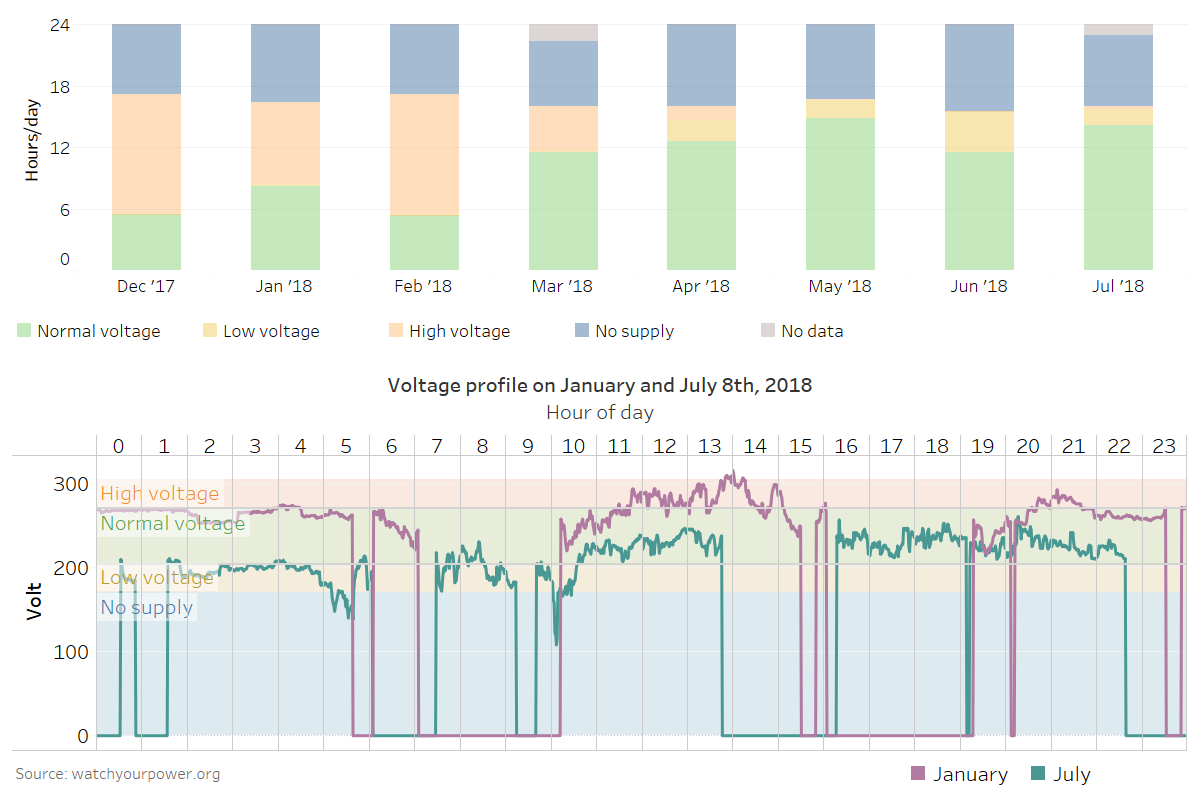
Figure 10: Daily electricity supply profile - Sikanderabad, Sitapur
Biswan
Biswan is a town in Sitapur district of Uttar Pradesh, about 80 km north of the state capital Lucknow. The number of outages has significantly gone down over the years, but the QoS as well as hours of supply have in fact worsened, with increased high voltage supply as well as outage hours.
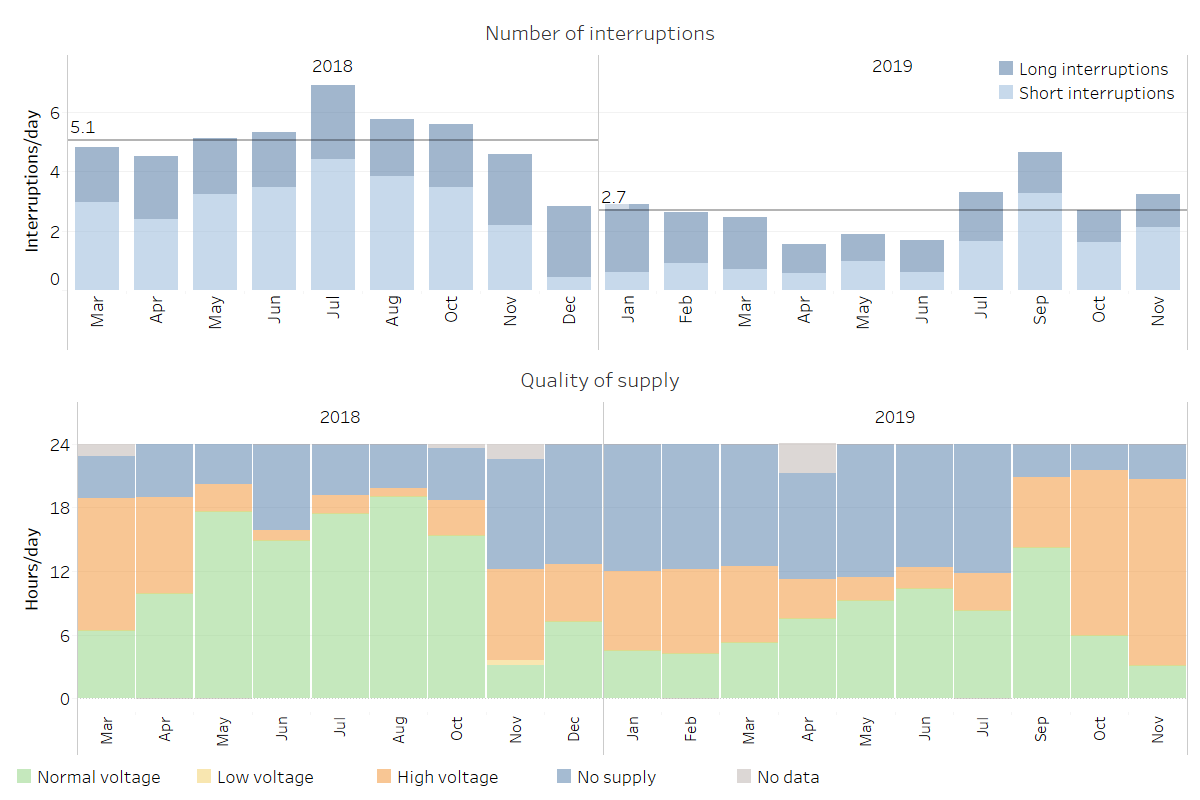
Figure 11: Quality of supply at Biswan Sitapur
Baraulia
Village Baraulia is in District Barabanki, about 70km from Lucknow. This village also received high voltage supply exceeding 300 volts on multiple occasions. Like Sikanderabad, hours of high voltage supply reduced gradually over time in Baraulia too. From the figure 12, it can be clearly seen that the duration of electricity supply at normal voltage slightly increased, but hours of outages have increased much more.
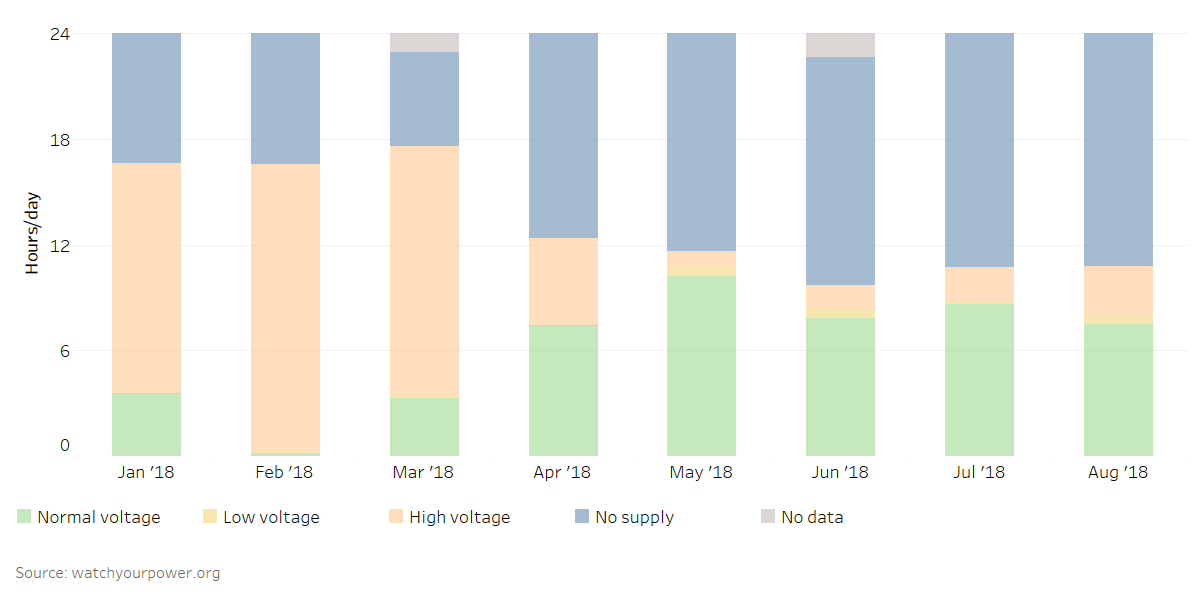
Figure 12: Daily electricity supply profile - Baraulia, Barabanki
Tap Sipaha
Tap Sipaha is a village in Barabanki district, about 70 km from Lucknow. The supply hours in this village were very low, averaging about 10 hours a day for the duration of monitoring. In addition to that, low supply voltage was also recorded for extended periods. Such extended periods of low voltage can potentially damage inductive loads such as motors. The daily hours of supply at normal voltage had shown marginal increase in the last two months of monitoring, significant improvement in supply quality is lacking.
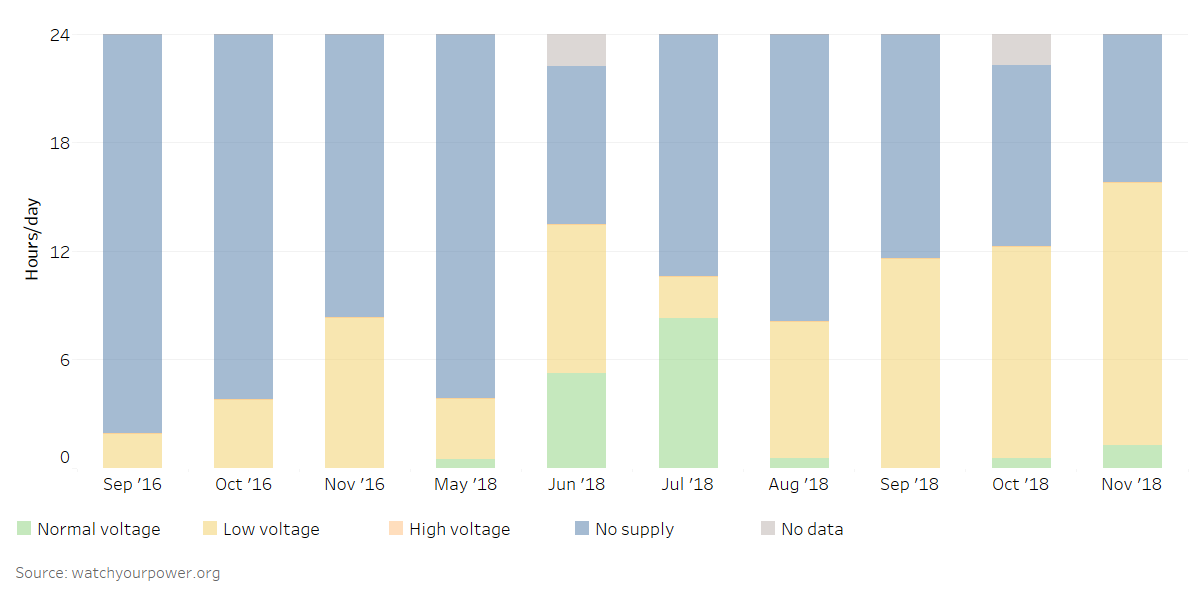
Figure 13: Daily electricity supply profile - Tap Sipaha, Barabanki
Huzurpur road, Kaisarganj
Kaisarganj is a town about 90km North-east of Lucknow, the state capital. The location received barely 8 hours of supply, that too barely any time at normal voltage in the earlier months of monitoring in 2018, with more than 10 interruptions per day. The quality of supply improved over time, especially in the non monsoon months. The number of interruptions also nearly halved at the same time.
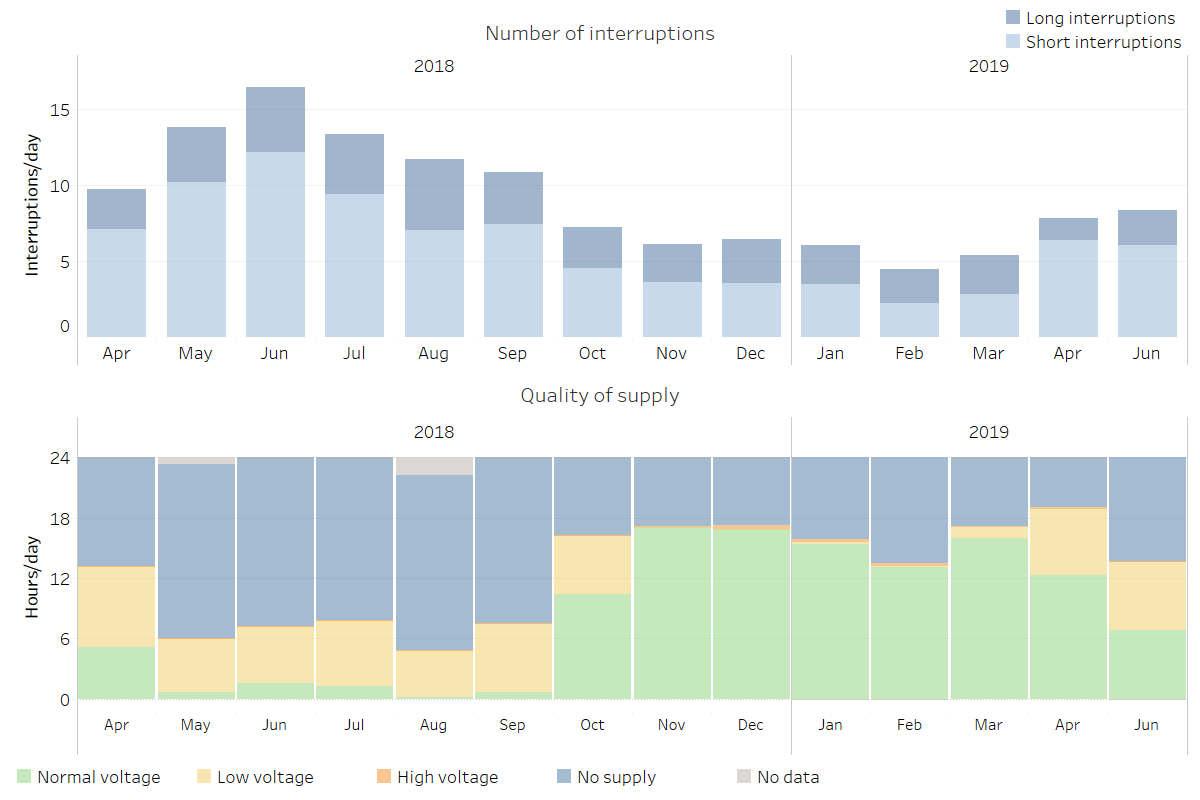
Figure 14: Quality of supply at Huzurpur road Kaisarganj
ESMI data shows that over four years, supply quality has been improving at certain locations in Uttar Pradesh. In some locations hours of supply increased, while at others supply quality improved, however the supply is still far from the ideal 24x7. This suggests there is a definite scope for improvement in providing good quality of supply. Data from particularly rural locations in Uttar Pradesh shows that supply of electricity is riddled with large number of interruptions, longer duration of outages as well as voltage fluctuations. Unavailability of electricity supply combined with frequent interruptions can pose a significant challenge in coming years as electrified households start using more appliances. Meeting this growing demand will require efficient planning and monitoring of supply.
Contributors: Shweta Kulkarni, Abhiram Sahasrabudhe, Aditya Chunekar, Shantanu Dixit
Please contact Shweta Kulkarni (
Suggested Citation: Prayas (Energy Group), ‘ESMI in Uttar Pradesh', part of blog-series on insights from monitoring quality of electricity supply at consumer locations in India under the ESMI, August 2021.
Please click here to read the other posts in this series.