
Insights from metering data in Uttar Pradesh and Maharashtra
In this post, we analyse the minute-wise load and voltage data of 81 households located in Uttar Pradesh and Maharashtra from 4th March, 2020 to 5th May, 2020 collected under our eMARC initiative to understand the impact of COVID-19 lockdown on their electricity consumption and quality of supply.
Key Takeaways
- The daily average electricity consumption of all the sample households was 26% higher in the lockdown period as compared to the pre-lockdown period
- Households with AC in Pune city and Pune district saw an increase of about 45-60%
- Households without AC saw an increase of 22% in Pune, 35% in Aurangabad, 45% in Gonda, and 114% in Kanpur Dehat. The maximum temperature in Pune was 3-4 degree Celsius lower than other districts.
- Average daily outage hours were about 10-18% less in the lockdown period as compared to the pre-lockdown period in all districts except Pune where it was 8% higher.
The Government of India ordered a nationwide lockdown for 3 weeks from 25th March, 2020 to control the spread of COVID-19. The lockdown has been extended a few times to date with gradual relaxation. It had a significant impact on the electricity demand due to reduction in commercial and industrial activities. The all India electricity consumption dropped by 22% in the first week of lockdown as compared to the peak of the previous week. In the initial lockdown period, the daily electricity consumption was 25-30% lower than its corresponding value in 2019 (see Figure 1). The residential electricity consumption, on the other hand, is expected to have increased during the lockdown as people spent more time at home. However, the actual impact is not clear as the official sector-wise data on electricity consumption is not available.
Figure 1: Daily all India electricity consumption (MUs)
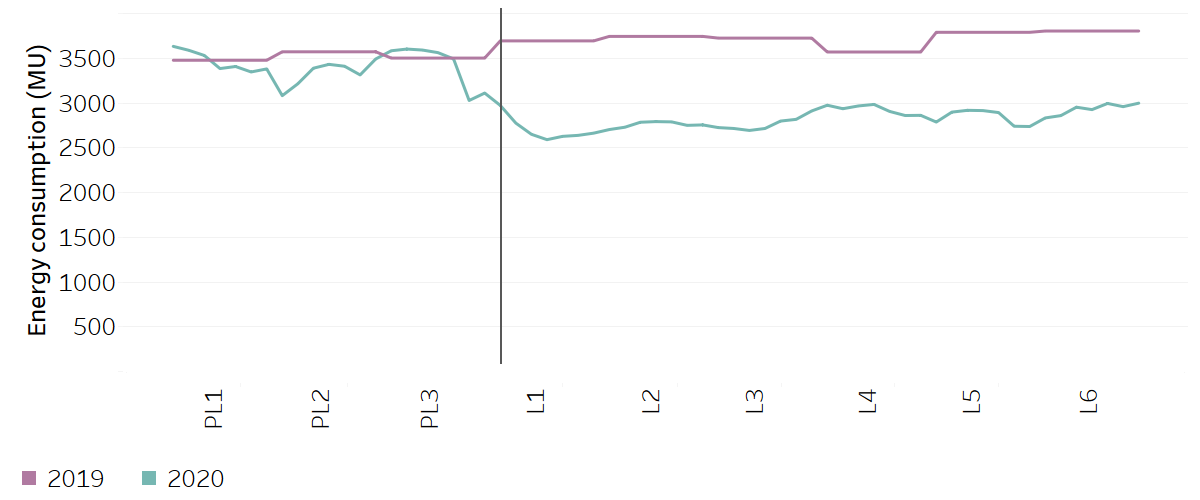
Note: PL1 to PL3 are pre-lockdown weeks 1 to 3 and L1 to L6 are lockdown weeks 1 to 6.
Source: National Load Dispatch Centre
We analyzed the minute-wise load and voltage data of 81 households participating in our eMARC initiative to examine the impact of the lockdown on their electricity consumption and electricity supply. More information about the eMARC initiative can be found here. Our analysis period is from 4th March, 2020 to 5th May, 2020. The distribution of the households considered for the analysis are given in Table 1. The eMARC sample has households from across different income levels across different regions but it has to be noted that it is not representative of India, state, district, or city.
Table 1: Distribution of eMARC locations considered for the analysis.
| Location | No. of households |
|---|---|
| Pune city | 28 |
| Pune district | 17 |
| Aurangabad district | 16 |
| Gonda district | 12 |
| Kanpur Dehat district | 8 |
| Total | 81 |
Table 2: Period of Analysis
| Pre-lockdown period (PL) | 3 weeks | 4th March, 2020 – 24th March, 2020 |
| Lockdown period (L) | 6 weeks | 25th March, 2020 – 5th May, 2020 |
Average daily electricity consumption increased in eMARC households during the lockdown
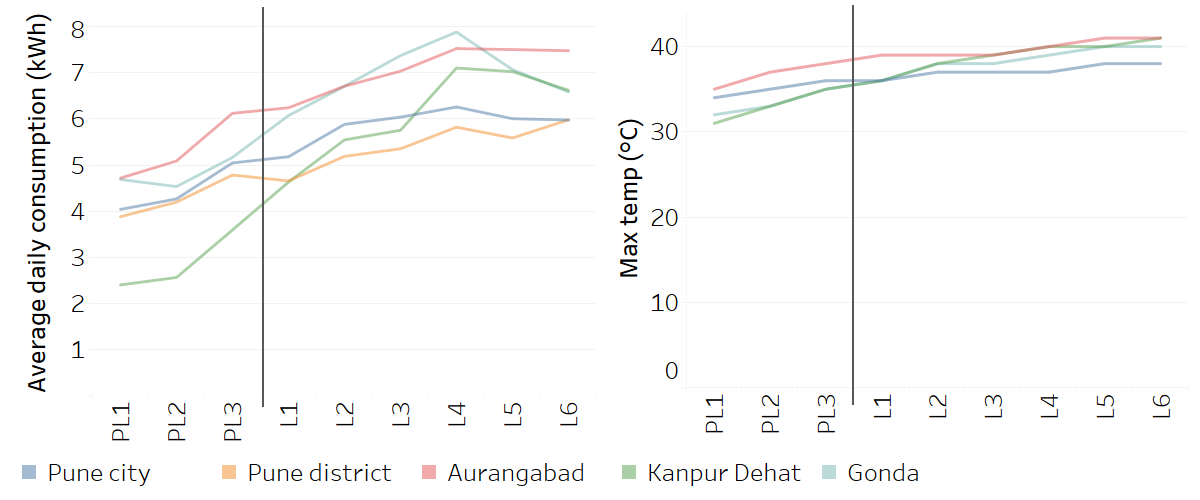
The electricity consumption increased in all the sample households (see Figure 2) with the daily average for the sample during the lockdown period being 26% more than the daily average in pre lockdown period. This increase can be attributed to two factors: increase in summer temperatures and people spending more time at home during lockdown. The actual magnitude of the increment varies with region and ownership of air-conditioners (AC). Households with AC in Pune district and Pune city experienced an increase of about 45-60%in their average daily electricity consumption in the lockdown period as compared to the pre-lockdown period. Our sample has only one household with AC in Aurangabad, and none in Gonda and Kanpur Dehat districts. The electricity consumption in households without AC in Aurangabad district increased by about 35% during the lockdown period. In Uttar Pradesh, the increase was significantly higher with households in Gonda consuming about 45% more whereas those in Kanpur Dehat consuming about 114% more in lockdown period compared to the pre-lockdown period. The maximum temperatures in these three districts are about 2-3 degrees Celsius higher than that in Pune which may be the reason for higher increase in electricity consumption. We have also observed, particularly in Uttar Pradesh, that the households start using their refrigerators only as the temperatures increase, keeping them off at other times. This may have further contributed to the increase in electricity consumption.
Figure 2: Average daily electricity consumption of eMARC households
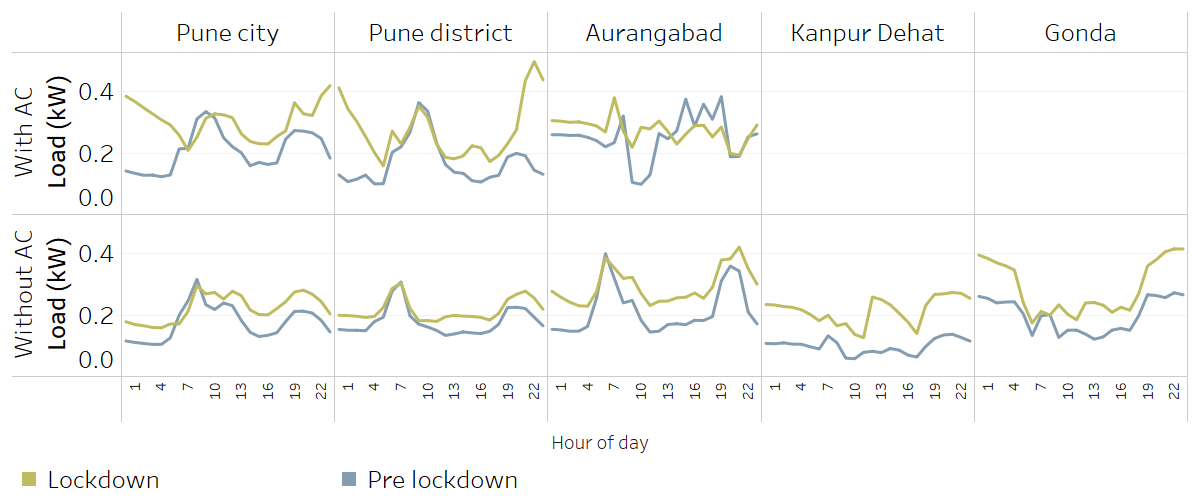
The average hourly load curves in the pre-lockdown period and the lockdown period show that the daytime load (10 am to 6 pm) increased for all the sample households across regions with or without ACs (see Figure 3). In households with AC, the night-time (10 pm to 6 am) load has increased significantly. Most of the households have used their ACs only at nights even during the lockdown.
Figure 3: Average daily hourly load curves of eMARC households
Outage hours were less in initial period of lockdown
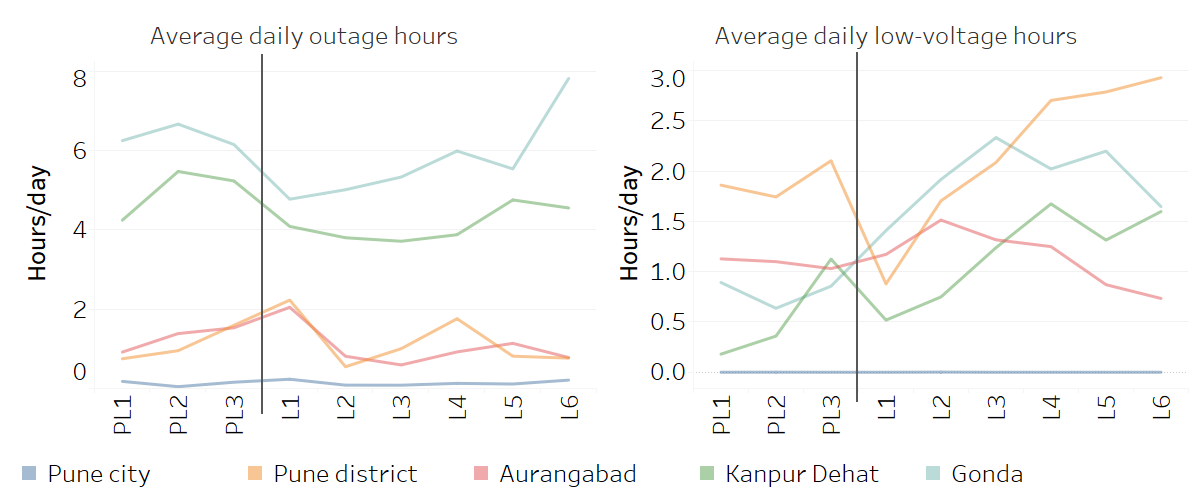
Average daily outage hours and average daily low-voltage hours are used as metrics for quality of electricity supply. If a voltage value is less than 204 Volts it is considered as low voltage. Based on these metrics, households in Pune city received good quality of electricity supply with, on an average, 10 minutes of outage per day and almost zero instances of low-voltage during the entire analysis period. Lockdown did not seem to have any significant impact on the quality of supply in the sample households in Pune city. The quality of supply is generally better in the sample households of semi-urban and rural areas of Maharashtra (1-2 hours of daily outage) as compared to those in Uttar Pradesh (5-6 hours of daily outage). There is no clear regional pattern to the quality of supply. The average outage hours were about 10-18% lower in the lockdown period as compared to pre-lockdown period in Aurangabad, Kanpur Dehat, and Gonda whereas it was about 8% higher in Pune. In Pune and Aurangabad, the outage hours were the highest in the first week of lockdown followed by gradual reduction. In Kanpur Dehat and Gonda, the outage hours started reducing in the week prior to lockdown and remained so before starting an increasing trend in the first week of May. However, an increase in the number of low-voltage instances was also observed in the same period. This was more prominent in Uttar Pradesh.
Figure 4: Quality of electricity supply in eMARC households
Impact on the state-wide electricity demand in Maharashtra and Uttar Pradesh
The households participating in the eMARC initiative are located in urban/semi-urban/rural areas of Maharashtra and Uttar Pradesh. We look at the data from respective State Load Dispatch Centres (SLDCs) to give a context to the consumption patterns of eMARC households (see Figure 5 and Figure 6). The drop in the total electricity consumption due to lockdown was more in Maharashtra than in Uttar Pradesh. In Maharashtra (excluding Mumbai), the electricity consumption dropped by 32% from 21st March to 26th March whereas the reduction was about 17% in Uttar Pradesh. The demand did pick up gradually with increase in temperatures and partly due to some relaxations post 20th April. But consumption was on an average 20-22% less below the 2019 level till the first week of May in both the states. The energy consumption in Uttar Pradesh was on an average 15% less than its 2019 level even in the pre-lockdown period. It has to be noted that residential electricity consumption accounts for about 19% of the total electricity consumption in Maharashtra (except Mumbai) compared to about 43% in Uttar Pradesh. This probably explains the lower percentage drop in electricity demand in Uttar Pradesh as compared to Maharashtra at the state level.
Figure 5: (a) Electricity Consumption (MUs) in MSEDCL (b) Daily Maximum Temperature for Pune
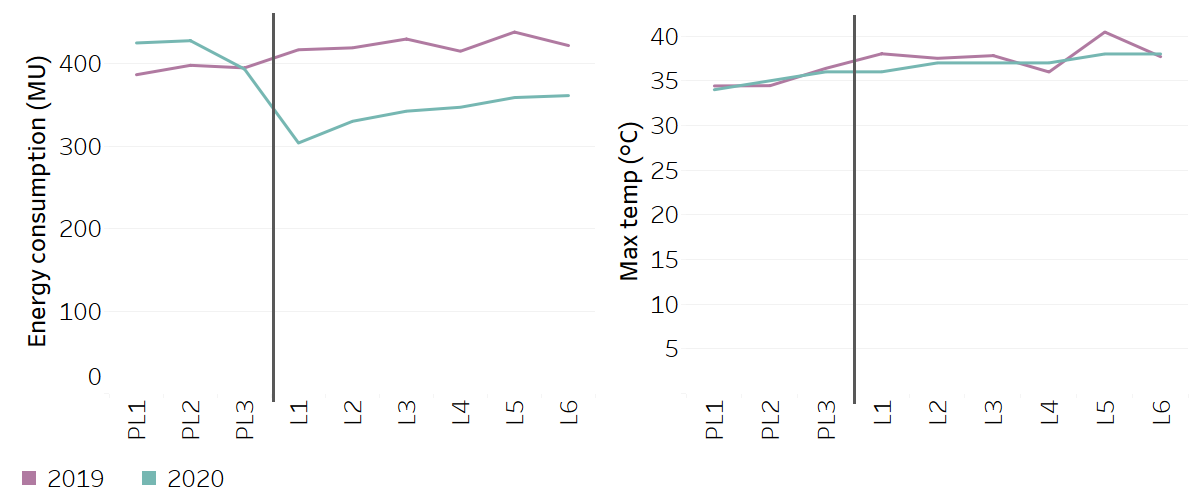
Note: Data is for Maharashtra State Electricity Distribution Company Ltd. (MSEDCL) which supplies electricity to all the state except Mumbai city and some of its suburban areas.
Source: (a) Maharashtra State Load Dispatch Centre (b) Climate Data Store
Figure 6: (a) Electricity consumption (MUs) in Uttar Pradesh (b) Daily maximum temperature for Lucknow
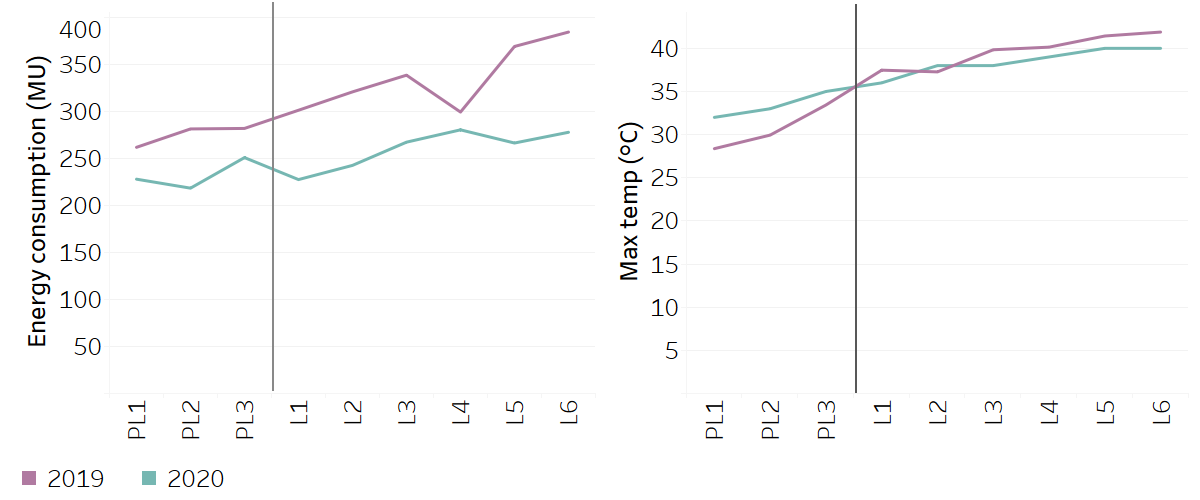
Source: (a) UP State Load Dispatch Centre for 2020 data & National Load Dispatch Centre for 2019 data (b) Climate Data Store
The COVID-19 pandemic is expected to change the way we work and live in both short and long term. This will also have a consequent impact on the electricity consumption across industrial, commercial and residential sectors. We will continue to examine this impact through analysis of our household metering data as well as the aggregate electricity demand data.
Contributors: Aditya Chunekar, Abhiram Sahasrabudhe, Shweta Kulkarni, Nimita Kulkarni
Additional data support: Sharmila Ghodke, Kailas Kulkarni.
We thank Karthik Ganesan and Shalu Agrawal from CEEW for providing the extracted relevant data for Uttar Pradesh for 2019.
Please contact Aditya Chunekar (
Suggested Citation: Prayas (Energy Group), ‘Household electricity consumption during the COVID-19 lockdown’, part of blog-series on smart meter data collected under the eMARC initiative, June 2020.
Please click here to read the other posts in this series.