
We discuss the details of how the Electricity Supply Monitoring Initiative (ESMI) was set up, how it works, and a brief history. ESMI is an effort by Prayas (Energy Group) started in 2015, to provide evidence-based feedback about the quality of electricity supply to all stakeholders in the electricity sector. Under ESMI, specially designed IoT enabled voltage monitors have been deployed at several consumer locations across India to develop a reliable database on supply interruptions and voltage levels. The minute-wise voltage data collected through ESMI is available in the public domain on watchyourpower.org and the Harvard Dataverse.
History
In 2007, Prayas Energy Group (PEG), launched the Electricity Supply Monitoring Initiative (ESMI) to collect real-time power quality information by installing Electricity Supply Monitors (ESM) in various locations in the city of Pune. Simple voltage data loggers were used as monitors. Data logged by these devices had to be collected physically at periodic intervals. This initiative was part of an effort by consumer groups and regulators in Maharashtra to monitor electricity supply quality since consumers faced frequent interruptions and significant load shedding in power supply. The data gathered through this initial effort was used by Prayas for several regulatory submissions. However, the upkeep of the systems was becoming difficult over time as it required regular manual interaction which also limited the possibility of scaling up the initiative.
The announcement of the Google Impact Challenge, set the ball rolling again in 2012. In the earlier stage, there was initial skepticism around the use of a technology-based solution for monitoring electricity supply. This included the possibility of mobile network failures, difficulty in finding on- field volunteers to host the device, developing a low-cost module for supply monitoring, and justifying the need for such a system in a much-developed environment of smart meters and SCADA systems. However, the lack of a transparent and automated data collection system on supply quality for the end consumer, remained unfulfilled. The Google impact challenge award provided the much-needed impetus to engage with different vendors who could provide potential solutions to build a robust system, which could monitor voltage every minute and transmit the same over the air from across several consumer locations in India. After multiple trial and errors Prayas was able to identify vendors who could develop devices that matched with the technical specifications that were required to build a robust electricity supply monitor. These devices were then rigorously tested in poor voltage and mobile network conditions to ensure they will work as expected in various supply conditions across the country. A comprehensive software and website were designed to enable Prayas to analyze and make available the data collected by these devices in a readable format to all users of the website. The main objective of the entire effort as discussed in the previous blog was to bring transparency in the information about electricity supply quality at various consumer locations. The actual roll out and implementation of ESMI helped Prayas achieve the same.
About Electricity Supply Monitors
Electricity Supply Monitor (ESM) is a plug and play device that continuously monitors and measures the supply voltage and sends that data to a server via GPRS. This device also has a data recording facility. If a GPRS connection is not available, the device stores data in memory and whenever connection resumes it sends recorded data to the server. The device has two major components: a) Voltage measurement circuit and b) Processing unit
Technical Details
Voltage measurement circuit: Each device has a single-phase voltage measurement unit. This unit can measure voltage between 120-300 Volts (Nominal), variation up to 10% of measurable range is acceptable for short duration. It has built-in protection against voltage spikes. It measures True RMS voltage with accuracy of ±1.0% of measured value i.e. Class 1.0 metering accuracy.
Processing Unit: Each device also has a processing unit which helps in data storage and communication over GSM network at 900/1800 MHz. GPS location is also captured by the device which is procured from the nearest mobile tower location. This helps in providing the approximate location of the device, useful for purposes of maintenance. Estimated energy consumption is <1Wh and instantaneous power consumption is 10W during the process of simultaneously measuring data and transmitting over the GPRS network.
About Quality of Supply Parameters
Continuity in electricity supply is desired at all times to ensure no loss to daily and production activities. An interruption is a condition in which power supply is stopped due to various reasons and the voltage value during that time interval is zero. Interruptions can also be caused as a result of voltage dips, voltage unbalance and fluctuations most of which lead to flicker in lights, equipment failures, affecting productivity etc.
The ESMI devices have the capability of capturing these interruptions in supply which are then used to determine the supply quality at a location for the given time. These interruptions are further classified into Short and Long interruptions. A short interruption is classified as one which lasts between 2-15 minutes and 16-60 minutes. While these interruptions are relatively short the losses in production activities can be important and also cause damage to other equipment. A long interruption on the other hand is an interruption which can last for a duration of 1-3 hours and more than 3 hours at any location. These interruptions, if frequent, force consumers to make investments in equipment to ensure continuity in supply. Any voltage below 130 V is treated as no-supply condition for calculating these interruptions as such low voltage is practically not useful and can lead to safety issues.

Figure 1: Voltage classification of recorded minute-wise supply
Normal electrical appliances in houses and commercial establishments, in line with relevant technical standards, are expected to operate smoothly within a broad voltage range of 205 to 270 V. Hence, this voltage range is marked as ‘Normal’. Voltage from 204 V and upto 131 V is shown as ‘Low’ voltage and voltage above 271 V is marked as ‘High’ voltage. Voltage below 131 (i.e. 130 and less) is considered as no supply (or zero voltage), as at such low voltage many appliances, tube lights etc. may not work and it might adversely affect safety of equipment and people. Agricultural consumers are typically supplied 3 phase supply, and in this case ESMI monitors and reports, 1 phase, phase to neutral voltage at these locations, with the same classification as above.
Electricity suppliers are expected to ensure supply voltage at consumer end within a band. This ‘declared or rated’ voltage band is specified by respective state electricity regulatory commissions (SERC) in their Standards of Performance or other similar regulations. Typically, SERC’s have a specified voltage range of 230 V + /- 6 % for single phase supply and 400 V phase to phase, + /- 6 % for three phase supply (this implies 230 V between phase and neutral). This translates into a specified voltage level of 216 V to 244 V. (e.g. DERC, APERC) Some SERC’s also specify a declared voltage level of 230 V or 240 V, with variation band of + /- 6 %. (MERC), implying approved voltage range of 226 V to 254 V. Current, BIS specified ‘rated’ / ‘nominal’ voltage for electrical installations is 240 V /415 V (IS 12360). But there is a move to align this standard to international IEC standard, which is 230 V / 400 V with allowed variation of + /- 10%, implying allowed voltage range of 207 V to 253 V for single phase supply or phase to neutral for a three phase supply.
Considering these regulations, accuracy of electricity supply monitoring devices and ESMI objective of primarily tracking supply quality for ordinary household, commercial and industrial establishments, we consider ‘normal’ voltage range as 205 V to 270 V, ‘low’ range from 204 V to 131 V, and ‘high’ range of above 271 V. Any voltage below 131 (i.e. 130 and below) is considered as no supply, as such low voltage is practically not usable and it might adversely affect safety of equipment and people.
How does ESMI Work
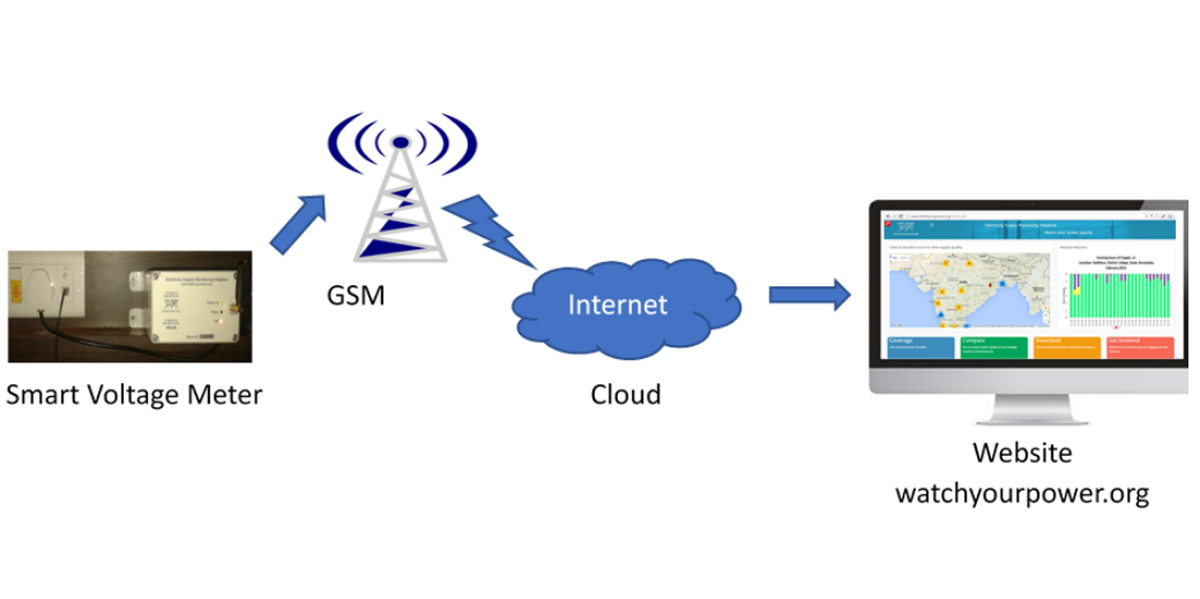
Figure 2: ESMI schematic
Data transmitted over GSM network from the electricity supply monitors from several locations across the country is collected at a web server. This data combined with demographic data related to the locations is analyzed via a pre-programmed software at the server end. The analyzed data is then made available to the public on the website in the form of location reports. The actual GPS location of the volunteer premises is not shared but to the level of village name or area name. Figure 3 explains one such report.
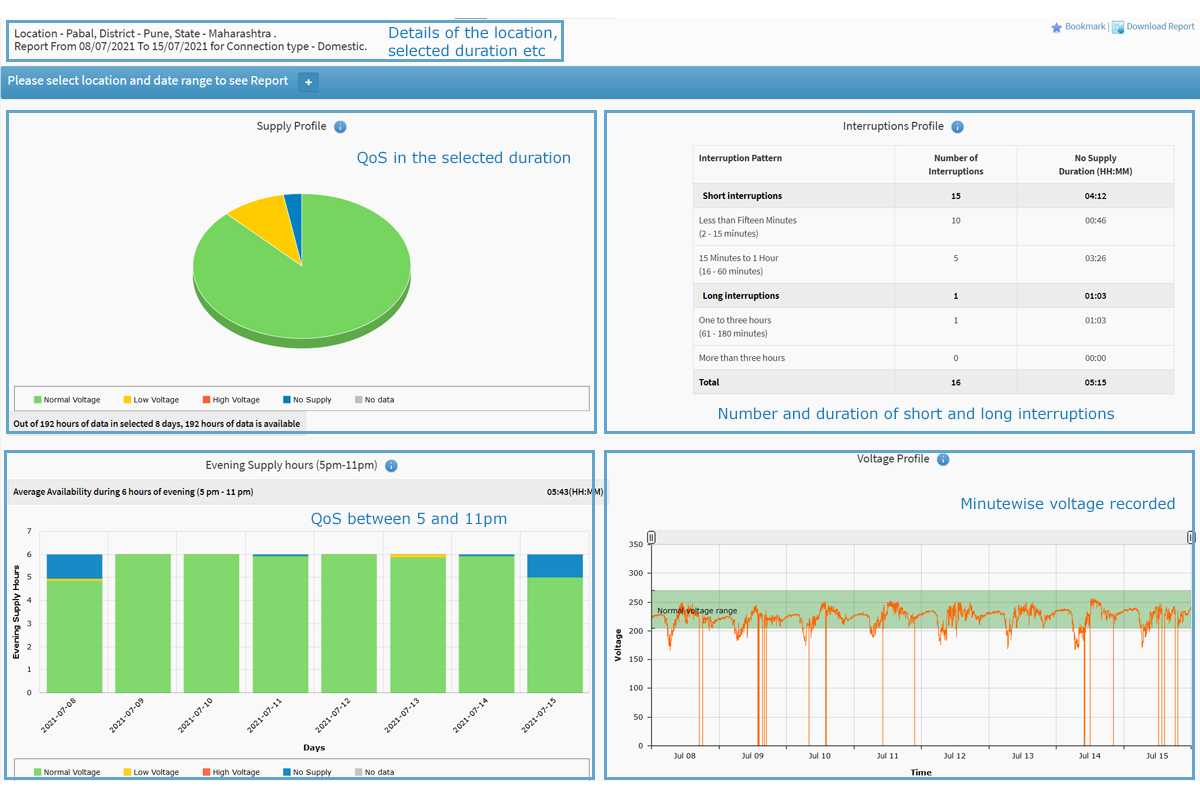
Figure 3: How to read an ESMI location report
The website also allows users to compare quality of supply at up to three locations for the selected duration. This is accessible through the ‘Compare locations’ tab from the burger menu.’ As shown in figure 4, quality of supply parameters for multiple locations can be compared for same time durations across three locations at one time. This feature helps users get a quick understanding of variation across locations of similar nature.
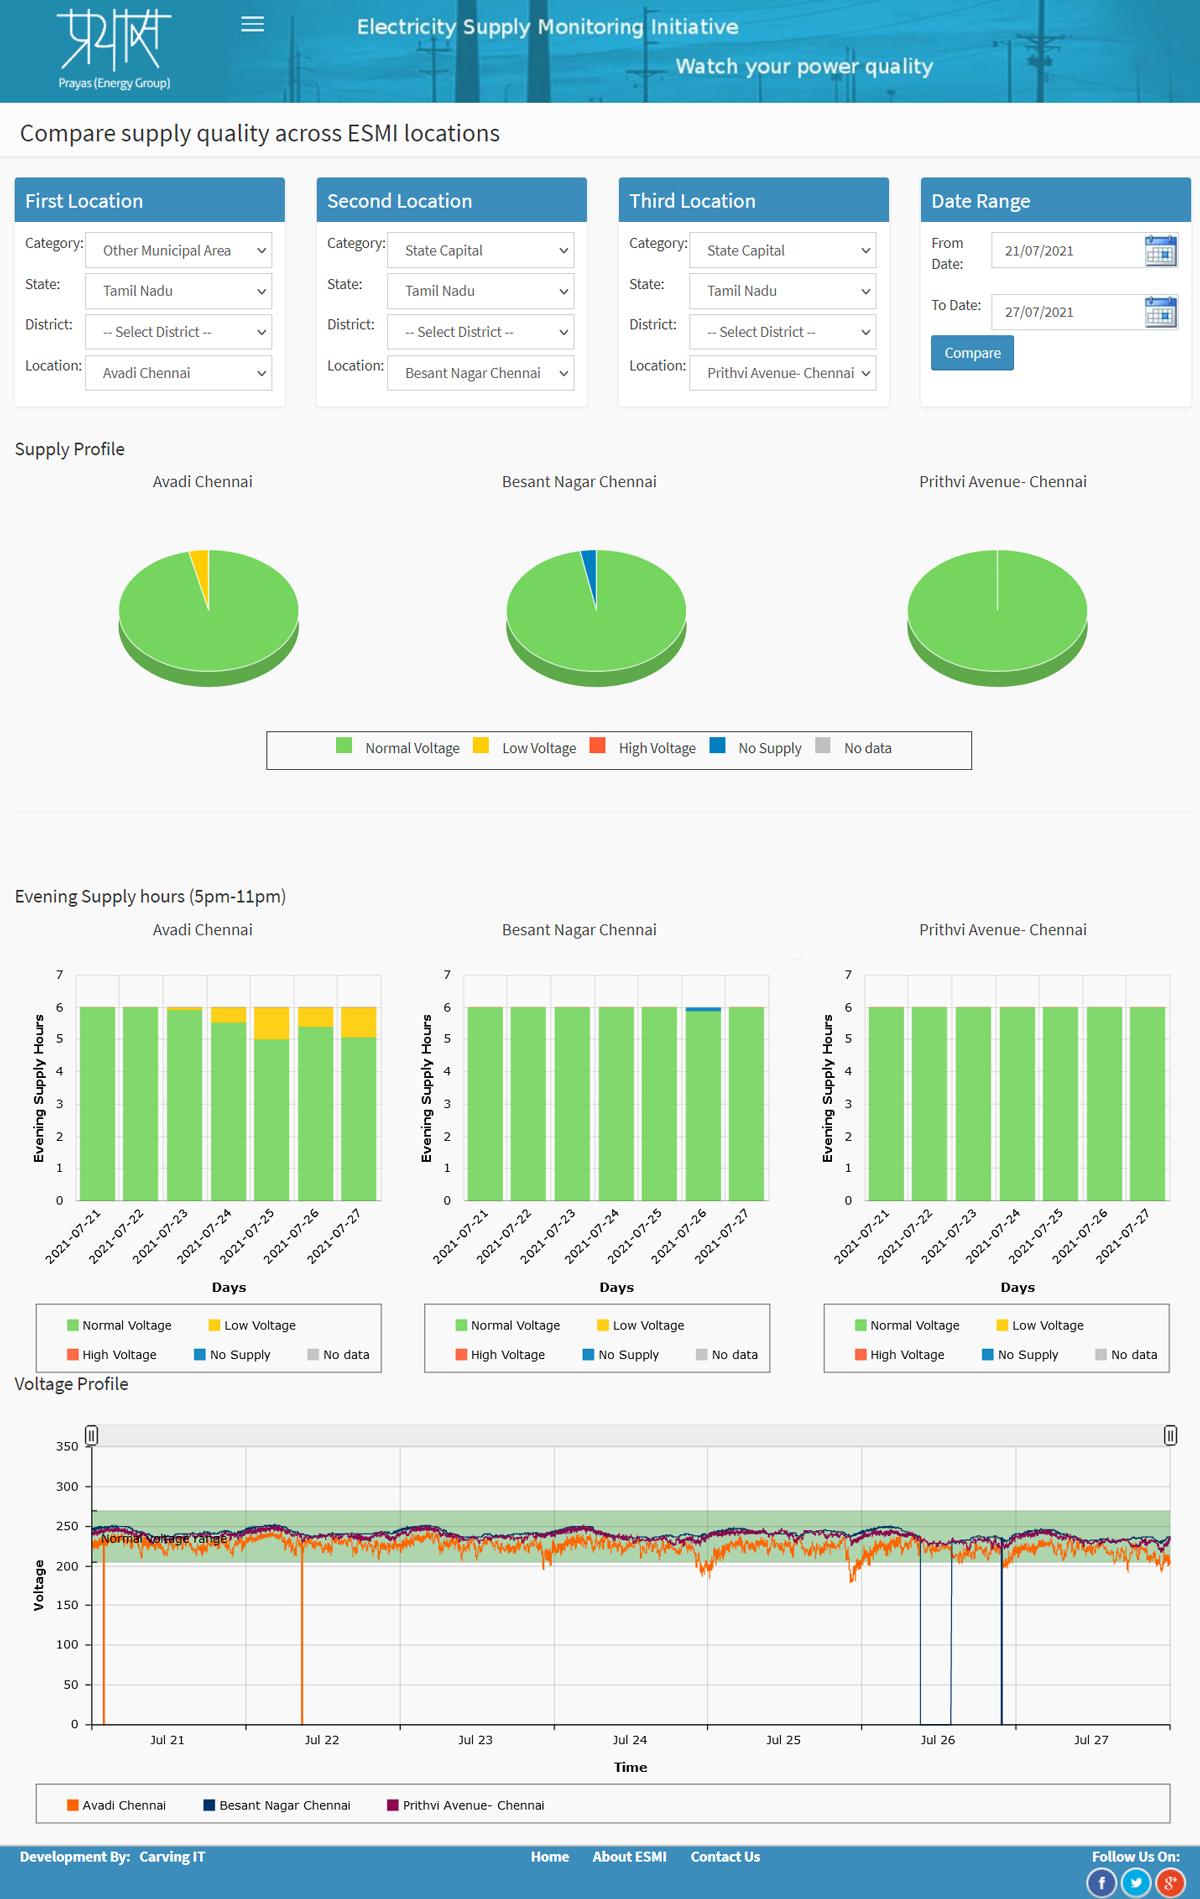
Figure 4: Compare locations report on watchyourpower.org
In addition to viewing location reports, the website also allows users to download hourly summary for a location for upto 3 months at a time and as described earlier the entire minute wise data has been made accessible via the harvard dataverse. A special user login can enable a user to download data for multiple locations at a time from the watchyourpower.org website. A user can request for a special user login to access this data for research/advocacy purposes. Another feature included on the website is detailed analysis reports at location and state level, which capture the variation quality of electricity supply. Figure 5 shows one such location report. The state report also gives the information of locations in the state on a map.
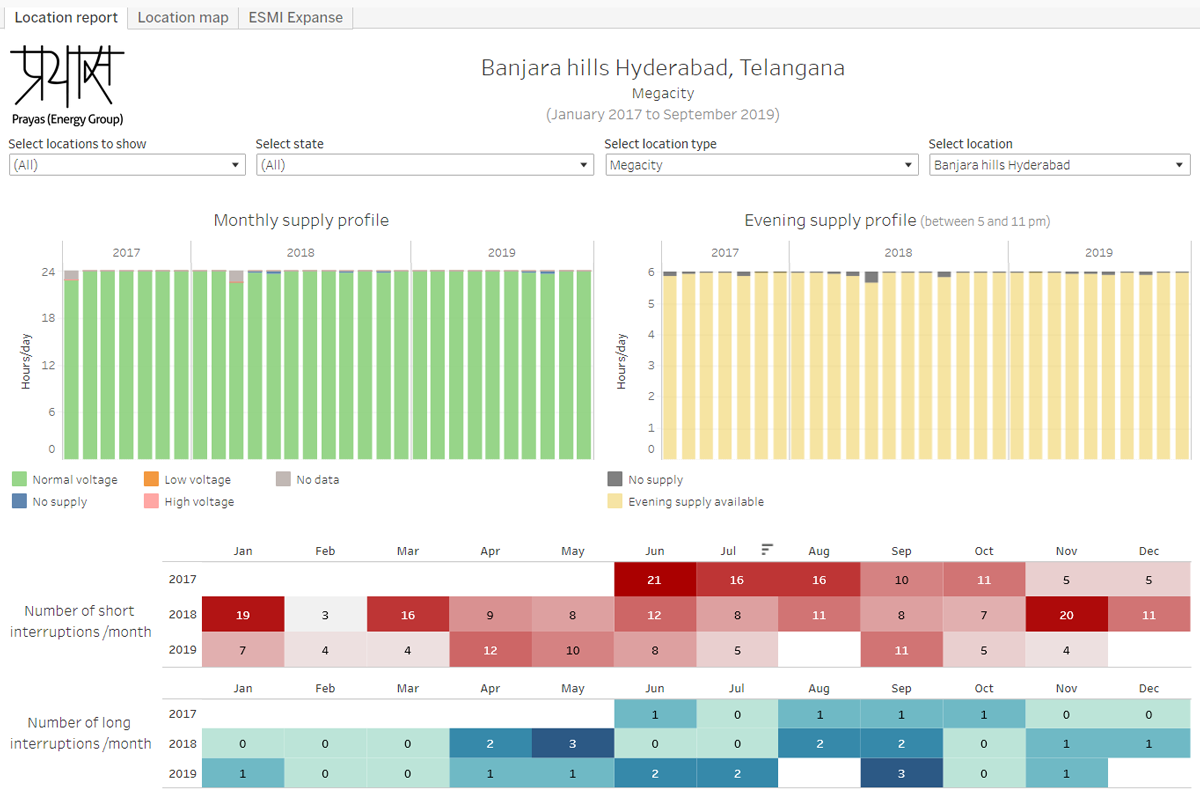
Figure 5: Location dashboard on ESMI website
Prayas has also published several analysis reports reports on supply quality across megacities, other municipal areas and rural areas across states through infographic reports. These have allowed users to get a quick glance on supply quality across the country.
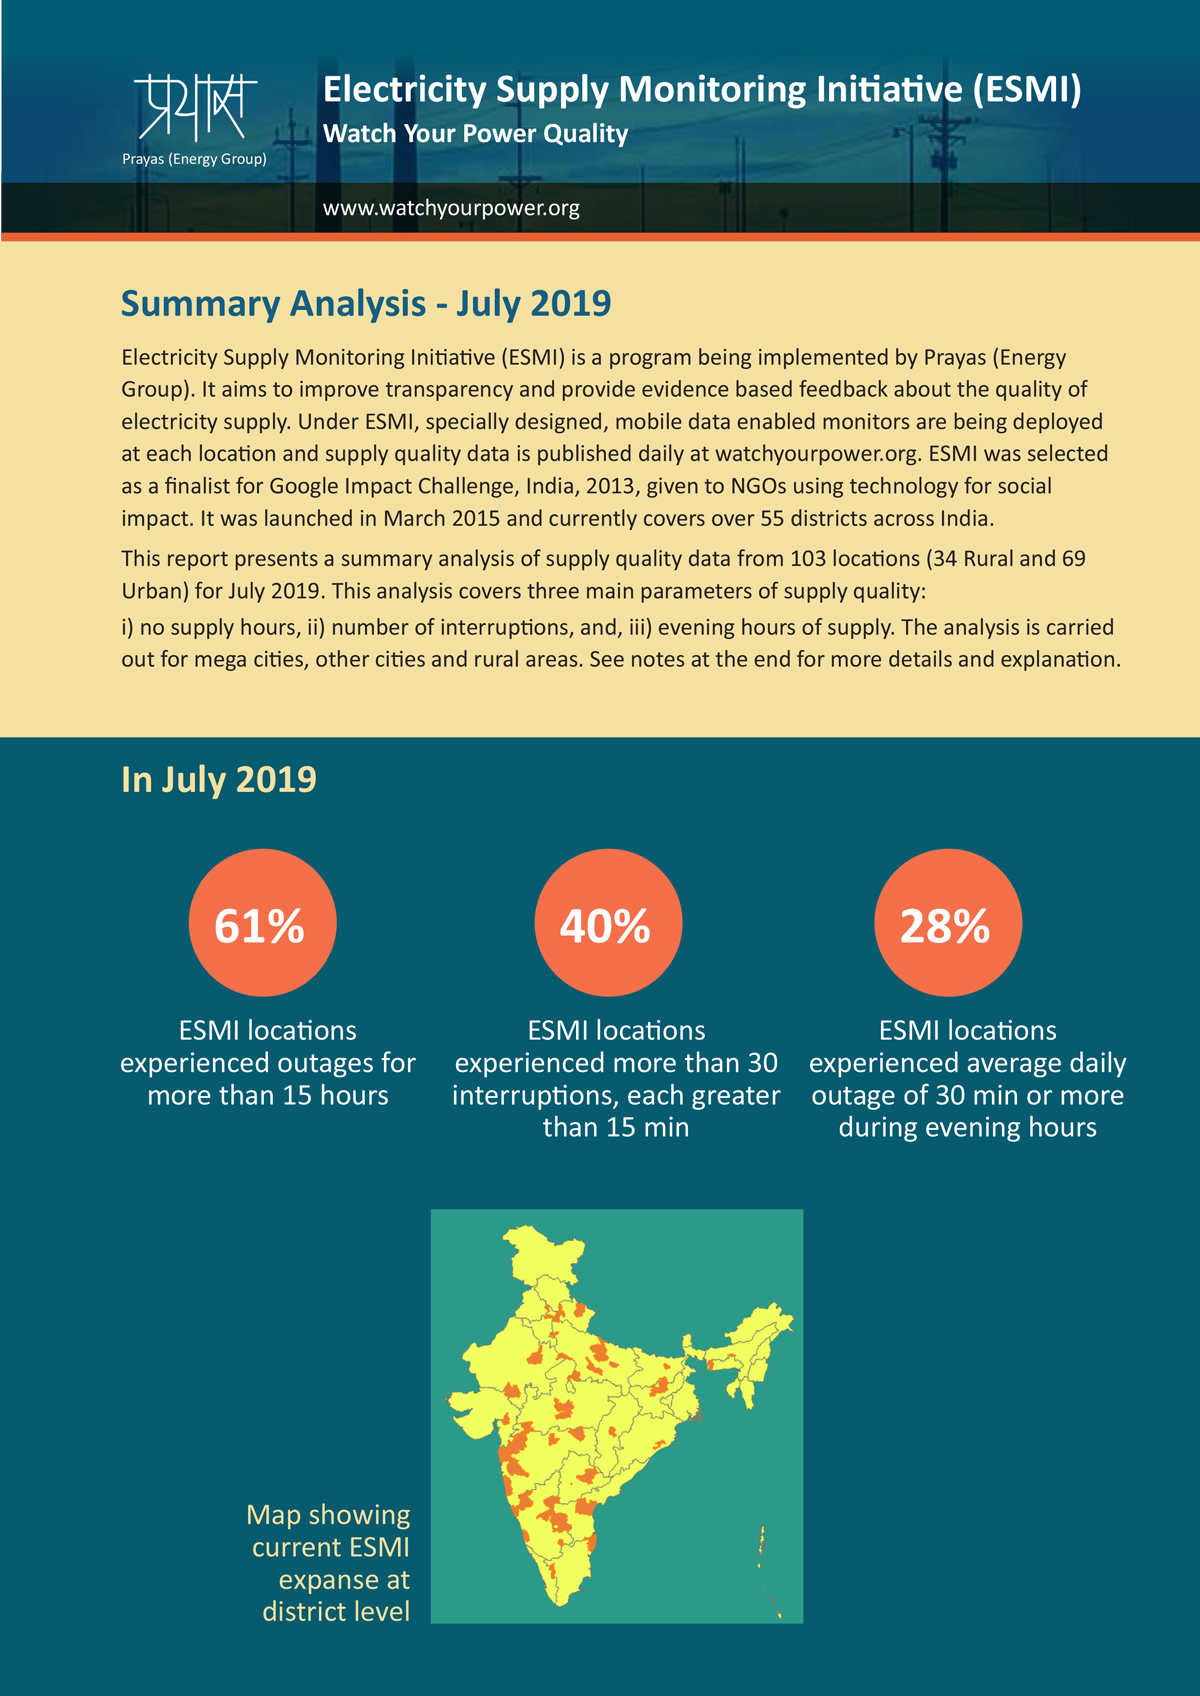
Figure 6: ESMI monthly analysis report
ESMI Expanse
Since the launch of ESMI, PEG has installed electricity supply monitors in more than 89 districts spread over 20 states in the country. Data from more than 400 consumer locations has been recorded in almost 10 million location hours of data. The deployment of devices was focused on covering more ground, as against installing several devices in one state or region. This strategy allowed for monitoring of supply quality on several more distribution transformers and feeders. In villages, towns and cities where multiple devices were installed care was taken to ensure they were installed on different feeder lines or different DTs such that we could obtain better representation of supply quality across that village or town. Supply quality varies across feeders or DT’s depending on the nature of loads connected and the quality of infrastructure. The details on village, town, city names where ESMI devices have been installed can be found here. Since the year 2019 the number of ESMI devices actively recording and sending data from locations have been reducing. The challenges in continuous operation, maintenance owing to unexpected changes in operation of GSM service providers, issues with supply quality which has led to damage of devices and reduced support at volunteer locations are a few reasons which have contributed to this reduction. We have discussed this in detail in the <blog post on challenges>
Several other countries which face similar electricity supply concerns have also found ESMI as a relevant mechanism to build evidence about supply quality. We have supported ESMI projects in Indonesia, Tajikistan, Kenya, Tanzania and Nepal by providing technical guidance, customising electricity supply monitors and full scale software support to local organizations in these countries.
Contributors: Shweta Kulkarni, Abhiram Sahasrabudhe, Aditya Chunekar, Shantanu Dixit
Please contact Shweta Kulkarni (
Suggested Citation: Prayas (Energy Group), ‘How does ESMI work?’, part of blog-series on insights from monitoring quality of electricity supply at consumer locations in India under the ESMI, August 2021.
Please click here to read the other posts in this series.

