
In this post, we analyse the minute-wise load and voltage data of 210 households collected under our eMARC and ESMI initiatives on 5th April, 2020 to understand their response to the Lights-off event
Key takeaways
- About 80% of the households in the sample responded to the call by switching off some of their load during the event time.
- Average demand reduction of 204 W/household of the sample was observed whereas the recovery was about 152 W/household.
- About 55% of the households in the sample followed the timings closely
- About 13% of the households had zero load during the event, some due to switching off all appliances and some due to power-cut.
In his address to the nation on 3rd April, India’s Prime Minister requested everyone to switch-off lights in their homes from 9:00 pm to 9:09 pm on 5th April and light candles or diyas as show of unity in the nation’s fight against covid-19 pandemic. This presented a challenge to the system operators to maintain the frequency of the national grid with the entire residential lighting load expected to go off suddenly at 9:00 pm and come back at 9:09 pm. POSOCO, the national load dispatch centre estimated this load to be about 12-15 GW and expected it to change in a matter of 2-4 minutes around lights-off and lights-on time. POSOCO also issued an advisory to all the regional and state load dispatch centres on steps to be taken regarding generation schedule and frequency control and voltage control to ensure reliable and secure grid operation. On 5th April, the actual reduction observed in demand was about 31 GW, almost double the estimated reduction. Rather than a sudden drop and a pick-up, the demand reduction and subsequent recovery was gradual, beginning at 8:45 pm and recovering at 10:10 pm (see Figure 1). According to the preliminary report by POSOCO, it managed the event in co-ordination with all the stakeholders without any major incident while keeping power system parameters within permissible limits using flexible hydro and gas generation capacity along with advanced grid management actions.
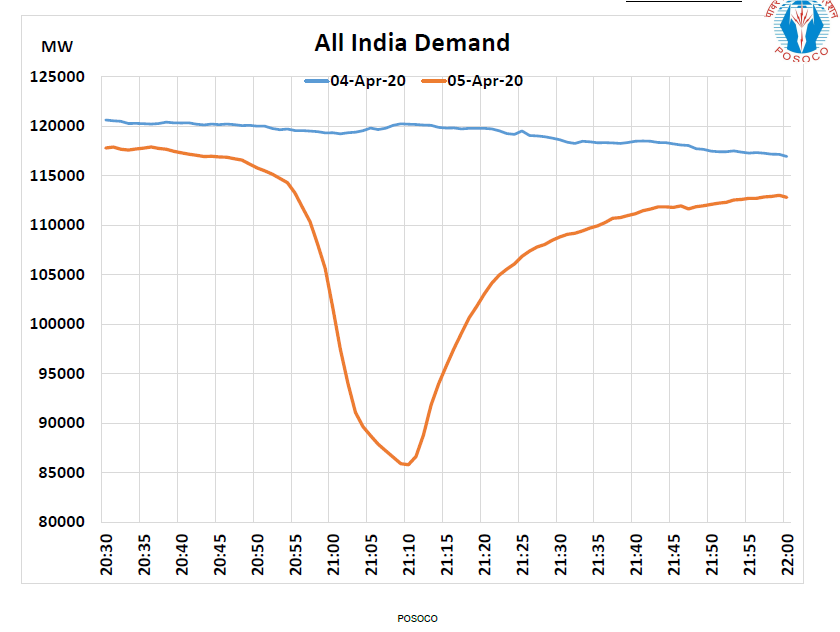
Figure 1: All India demand on 5th April, 2020.
Source: POSOCO
This event will surely be studied in detail in future to examine both the nature of demand change during the event and the actions taken to manage the grid. We analyzed the minute-wise load and voltage data of 210 households participating in our two remote monitoring initiatives: eMARC (Monitoring and Analysis of Residential Electricity Consumption) and ESMI (Electricity Supply Monitoring initiatives). More information about these initiatives can be found here. The eMARC data (minute-wise load and voltage) used for this analysis is from 95 households while the ESMI data (minute-wise voltage) used for this analysis is from 115 households. Their distribution across locations is given in Table 1.
Table 1: Spread of eMARC and ESMI locations
| eMARC | ESMI | ||
| Location | No. of households | Location | No. of households |
| Pune City | 29 | Uttar Pradesh | 30 |
| Pune district | 20 | Maharashtra | 28 |
| Aurangabad district | 22 | 18 states | 57 |
| Gonda district | 13 | ||
| Kanpur Dehat district | 11 | ||
The objective of this analysis is to understand two things: (a) behavioural response of these households to the lights-off event which can throw some light on the actual demand reduction observed and (b) voltage variation observed by these households during the event. The eMARC and ESMI sample has households from across different income levels across different regions but it has to be noted that it is not representative of India, state, district, or city.
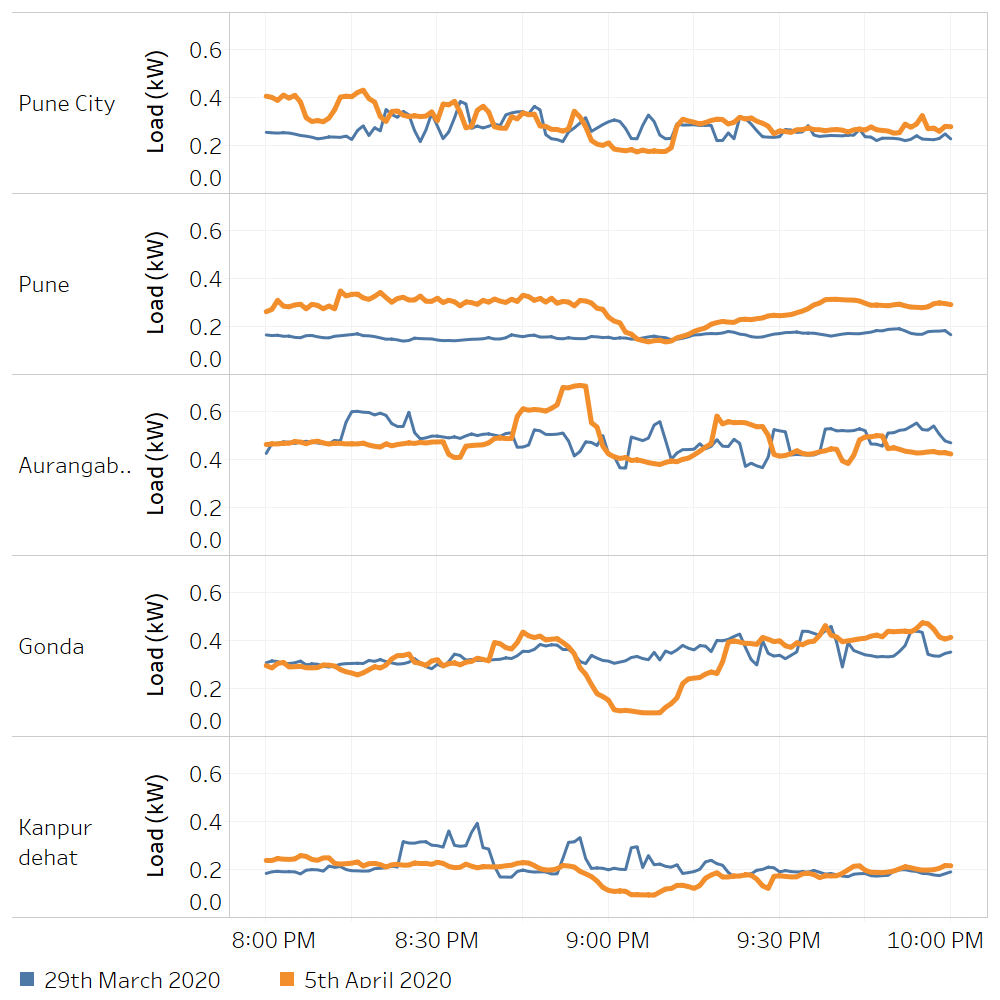
The average load curve of the eMARC households gives an idea of the combined response of the sample to the lights off event (Figure 2). The maximum pre-event load is at about 404 W/household at about 8:54 pm. There is another peak at 8:45 pm suggesting some households may have started responding early as also indicated by India level demand. The demand reduces to about 204 W/ household at 9:07 pm and then recovers to about 352 W/household at about 9:23 pm. Thus a reduction of about 204 W/household is observed at the sample level during the event with a recovery of about 152W/household. The average load curves (Figure 3) in Pune city and the districts vary from each other with the maximum demand reduction of 327 W/household observed in Gonda. The load in Pune and Aurangabad districts was higher on 5th April compared to 29th March (the previous Sunday), almost similar in Pune city and Gonda district, and lesser in Kanpur district.
Figure 2: Average load/household curve for eMARC sample on 5th April and 29th March.
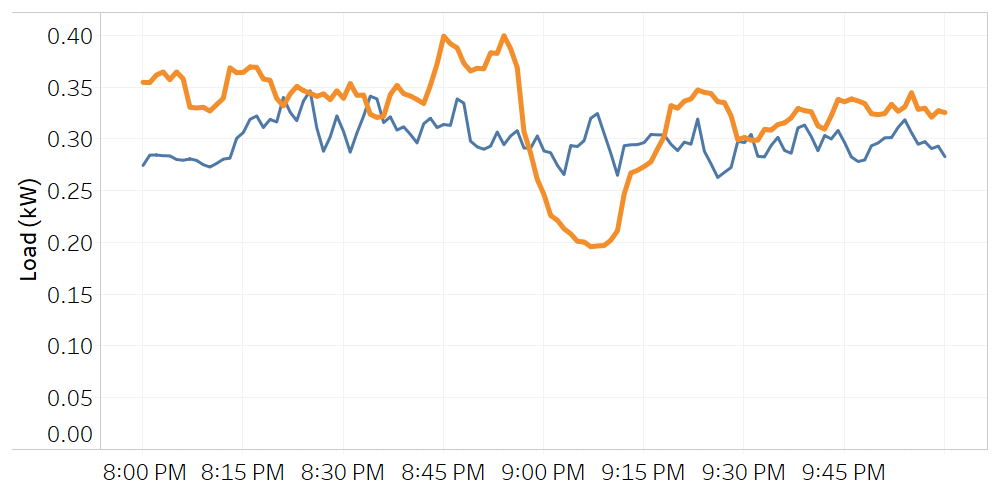
Figure 3: Location-wise average load/household curves for eMARC sample on 5th April and 29th March
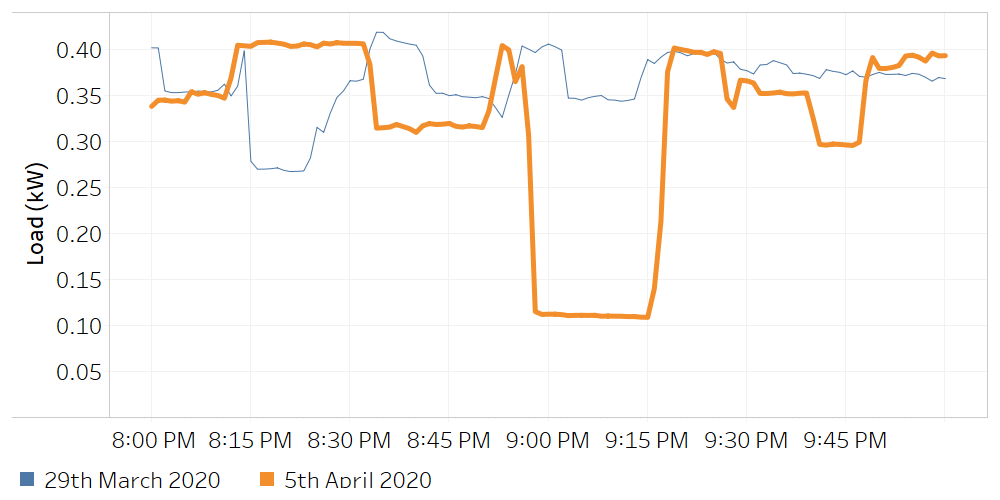
Individual load curves reveal some patterns in the households’ response to the lights-off event. We analysed the main-line and refrigerator load curves from both 5th April and 29th March to analyse the patterns. About 78 households (i.e. about 80% of the sample) responded to the call by switching off some of their load during the event time. About 53 of these households (i.e. about 55% of the sample) followed the timings with a narrow margin. Figure 4 shows the load curve of one such household. About 25 households (i.e. about 25% of sample) the timings were not very strictly followed. In most cases, the drop of load was within 5-10 minutes but the recovery was gradual (see Figure 6).
Figure 4: Load curve of a household with timely switch-off and switch-on during the event time
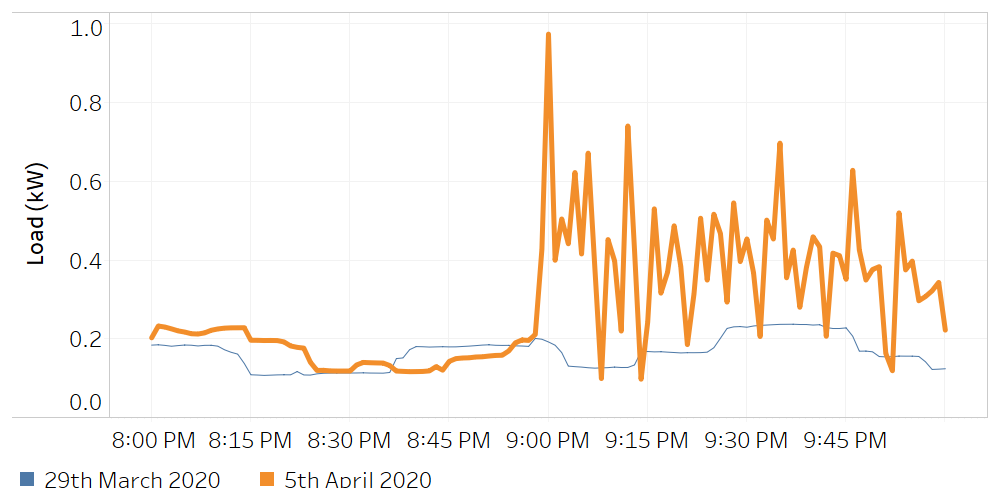
About 15 households (i.e. 16% of the sample) reduced their load on 5th April by either delaying the switching-on of appliances or avoiding its use as compared to 29th March. Figure 5 shows the load curve of such a household. Their average load on 5th April in the time 8.00 pm to 10.00 pm was less as compared to the 29th March. On the other hand, for about 24 households (i.e. 25% of the sample) the average load on 5th April was higher than the load on 29th March in the same time slot (see Figure 6). Some of these load changes maybe unrelated to the event but it is difficult to identify the intention. However, in some cases, it is quite evident that the household increased the load in response to the lights off event. This maybe in response to the awareness generated through media particularly social media on the possible threat to grid stability. Figure 8 shows the load curve of one such household.
Figure 5: Load curve of a household with reduced load on 5th April compared to 29th March
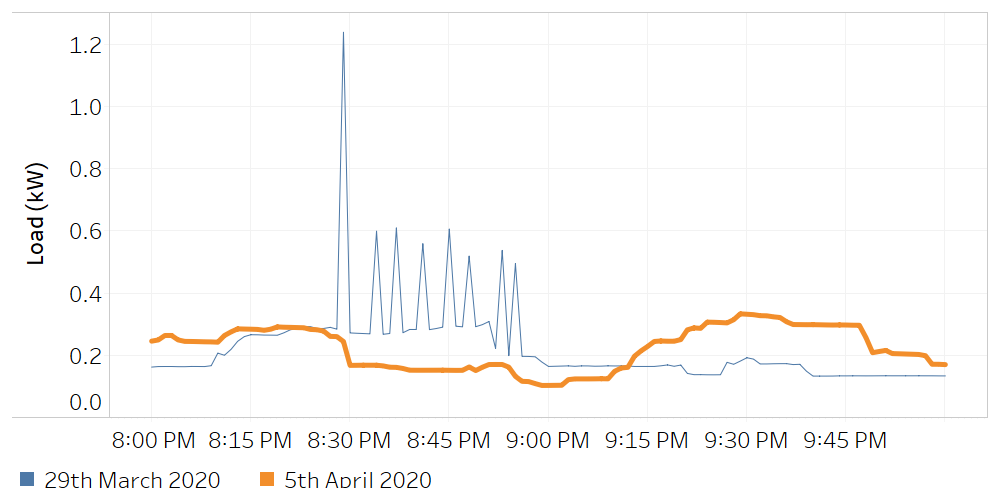
Figure 6: Load curve of a household that increased load on 5th April before the event
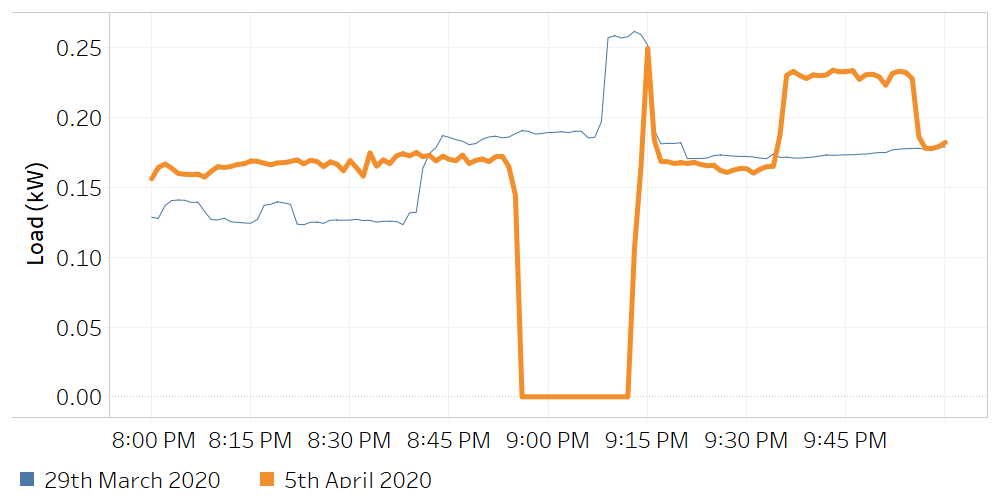
About 12 households (i.e. 13% of the sample) showed zero load during the event. Figure 7 shows the load curve of one such household. This can either be due to the households switching off all the appliances or there being a power cut. About 7 out of these 13 households switched-off their appliances as their voltage values are non-zero. We could verify 2 cases of power-cuts whereas in three cases it may either be a switch-off from mains or a power cut. A couple of households switched off their refrigerator while keeping other load on.
Figure 7: Load curve of a household with zero load during the event time
We now move to the supply quality between 8:30 pm to 9:30 pm on 5th April. About 7 households (i.e. 7% of the sample) experienced a power-cut during that time with uncertainty around 3 households. Five of them were in Kanpur Dehat, one each in Pune and Gonda district. Voltage data from about 115 households under ESMI initiative shows about 5 households (i.e. about 4% of the sample) experiencing power-cuts between 8:30 pm and 9:30 pm on 5th April. Almost all the households experienced low voltage levels before the event (see Figure 8 and Table 2). The voltage levels increased as the event progressed before stabilizing. The variation in the voltage levels across the households and locations can be attributed to the quality of the local distribution networks. It will be difficult to identify specific effect of this event on voltage levels.
Figure 8: Voltage variation in all eMARC households on 5th April, 2020
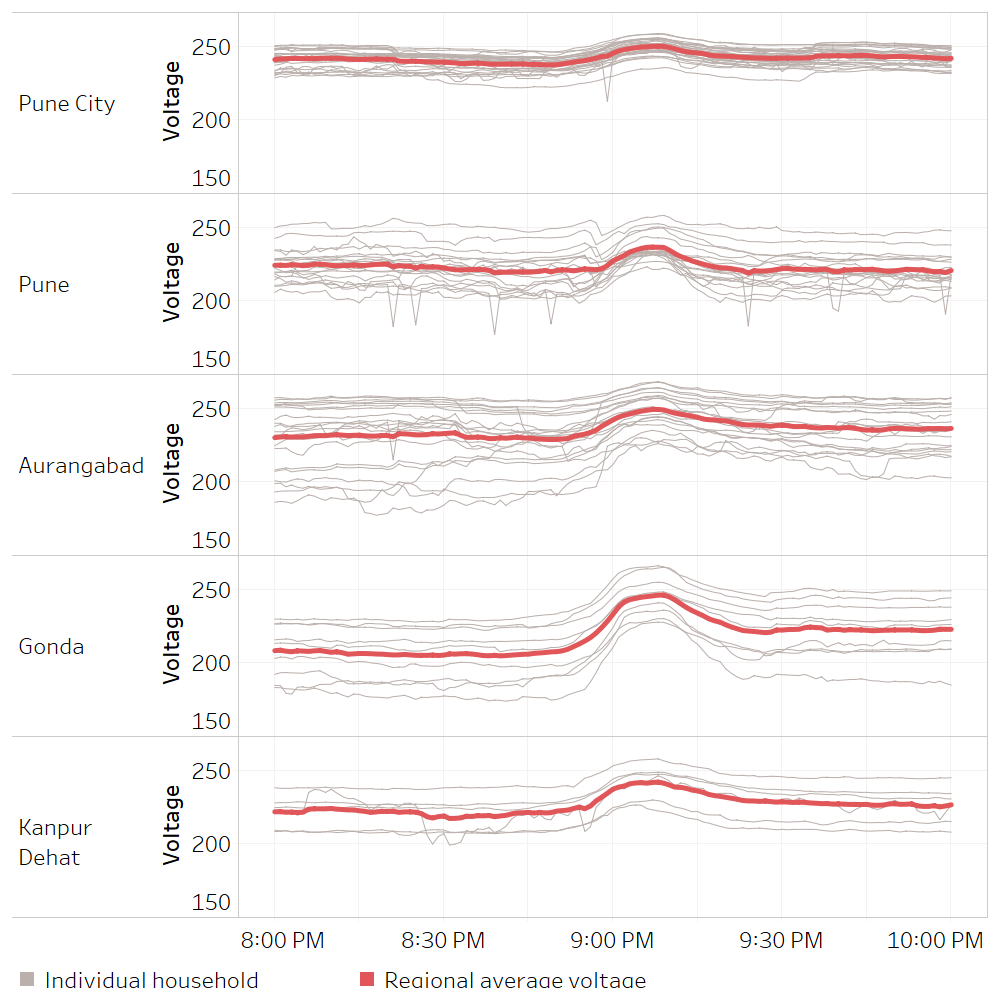
Table 2: Voltage levels in eMARC locations on 5th April, 2020
| Location | Voltage at 8:45 pm | Voltage at 9:09 pm | ||||
| Minimum | Average | Maximum | Minimum | Average | Maximum | |
| Pune City | 221.9 | 237.7 | 247.0 | 235.4 | 249.7 | 258.4 |
| Pune | 201.8 | 219.4 | 246.9 | 228.8 | 236.1 | 257.9 |
| Aurangabad | 193.5 | 229.6 | 255.5 | 224.9 | 248.7 | 267.3 |
| Gonda | 176.8 | 205.8 | 231.1 | 227.5 | 245.8 | 265.1 |
| Kanpur Dehat | 208.5 | 221.8 | 238.6 | 221.7 | 241.1 | 256.3 |
Please contact Aditya Chunekar (
Suggested Citation: Prayas (Energy Group), ‘Insights from household metering data on response to Lights-off event of 5th April, 2020’, part of blog-series on smart meter data collected under the eMARC initiative, April 2020.
Please click here to read the other posts in this series.