Summer weather patterns in Maharashtra
|
Key takeaways
|
It is early summer, and we are already feeling the heat. The Indian Meteorological Department (IMD) issued this season's first heatwave warning in Mumbai and Konkan in February. The earth witnessed the hottest January in the last 176 years despite being in the La Nina phase which is typically associated with cooler weather. Extreme heat has serious public health consequences. In 2019, total deaths in Maharashtra attributable to extreme heat were estimated to be about 14,000 to 16,000, which is around 2% of overall deaths in the state in that year. Beyond health, the economic costs of extreme heat are significant. India lost about $141 billion in potential income due to reduced labor capacity caused by heat in 2023. Heat also drives up electricity demand as people rely on their air-conditioners, air-coolers, and fans for relief. Space-cooling appliances make up nearly half of India's total residential electricity consumption. Air-conditioners use a lot of electricity, especially during peak demand hours, which can put pressure on the power grid. If not managed properly, this can lead to power cuts. Also, generating more electricity often leads to higher greenhouse gas emissions since most of India’s power comes from coal. These emissions contribute to climate change, which in turn causes temperatures to rise even more. The impacts of heat on human health depend on factors such as exposure, population vulnerability, and ability to adapt, which vary across locations. Effective adaptation requires both short- and long-term strategies across multiple sectors, tailored to local needs.
In a series of articles over this summer, we will examine different aspects of extreme heat with a focus on Maharashtra. The insights gained may also help heat adaptation efforts in other parts of India. This first article will delve on the changing summer weather patterns in the state. It will also briefly discuss the challenges of using various data sources and parameters.
Quantifying the summer heat
More than just temperature
Summer heat is typically associated with temperature alone, but factors such as humidity, solar radiation, wind speed, exposure conditions, and an individual's ability to adapt are also critical. The combined effect of all these parameters determines health risks to an individual. Globally, various heat stress indices have been developed, incorporating multiple parameters, to arrive at a 'feels-like' temperature. This is considered to be a more accurate measure to quantify heat. However, none have been tested in the Indian context. This is one of the gaps that needs to be addressed.
In absence of a locally tested heat index, we use the Universal Thermal Climate Index (UTCI) for an indicative analysis of the change in weather patterns in Maharashtra. UTCI is based on a dataset which combines weather station records, satellite observations, and climate models to provide hourly estimates of weather parameters at a 0.25° X 0.25° grid resolution (~28 km x 28 km for Maharashtra).
Need for more local weather station data
We calculated district level averages for each of the 36 districts of Maharashtra using UTCI data that covered most part of the individual district. This method underestimates the Urban Heat Island (UHI) effect, where cities retain more heat due to concrete and asphalt surfaces. Despite this limitation, district level averages provide a broad picture of heat stress in the state.
The India Meteorological Department (IMD) operates about 60 weather stations in Maharashtra, but station-wise real-time data is not publicly available. Instead, data is released after a couple of months at an approximate estimated cost of Rs. 40,000 per weather station per year. IMD can make this data publicly accessible on a near real time basis at a reasonable cost. Given that heat impacts are highly localized, higher-resolution weather data is crucial to assess its impacts. Additional Automated Weather Stations (AWS) may offer a complementary solution. For instance, Zomato has deployed AWS systems in major cities and made the data public, enabling researchers to conduct localized heat studies.
How bad was the Summer of 2024 in Maharashtra?
2024 has been the hottest year recorded so far. But how was it experienced in Maharashtra? One way to evaluate heat stress is using UTCI ranges (see table below). Using this criterion, our analysis reveals that most of Maharashtra faced severe heat stress for much of the summer (March, April and May).
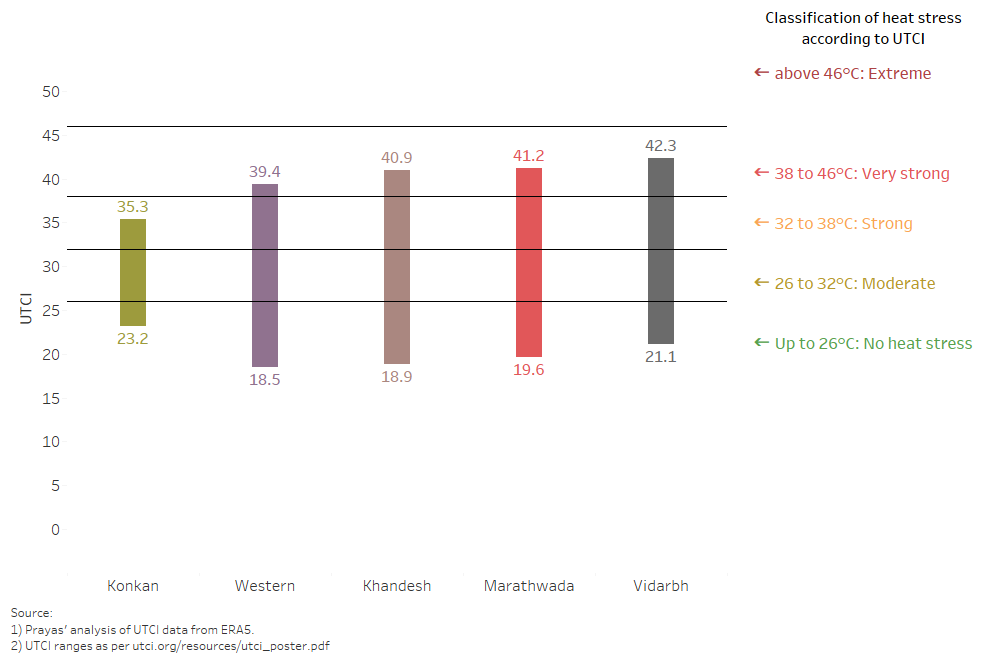
Figure 1: Summer-wide average of daily maximum and minimum UTCI in Summer of 2024 across Maharashtra
The National Disaster Management Authority (NDMA) recommends a localized method to identify heat stress. According to this approach, heat stress occurs when temperatures go beyond the 95th percentile threshold. This threshold for a particular day in a month is calculated from the daily maximum temperature values of all days in that month over a 30 year period. We use a similar approach using UTCI instead of temperature to assess the heat stress.
Day time heat: Worst in Konkan and Western Maharashtra
The body's ability to adapt to heat is affected significantly by how the given temperature at any time varies from the normal temperature for that period. The India Meteorological Department (IMD) defines normal temperatures based on a 30-year average. In 2024, the daily maximum UTCI in all districts of Konkan and Western Maharashtra consistently exceeded their respective normal maximum values. In contrast, most districts in Vidarbha and Marathwada, traditionally the hottest regions in Maharashtra, recorded maximum UTCI values lower than their normal maximum values.
This indicates that daytime temperatures were higher than usual in Konkan and Western Maharashtra while being relatively lower than the long-term norm in Vidarbha and Marathwada. However, it is important to note that absolute maximum UTCI values in Vidarbha and Marathwada remained very high, with significant thermal stress potential.
Further analysis using the 95th percentile criterion shows that the number of extreme heat days—when maximum UTCI exceeded the 95th percentile—was significantly higher in Konkan and Western Maharashtra compared to Vidarbha and Marathwada.
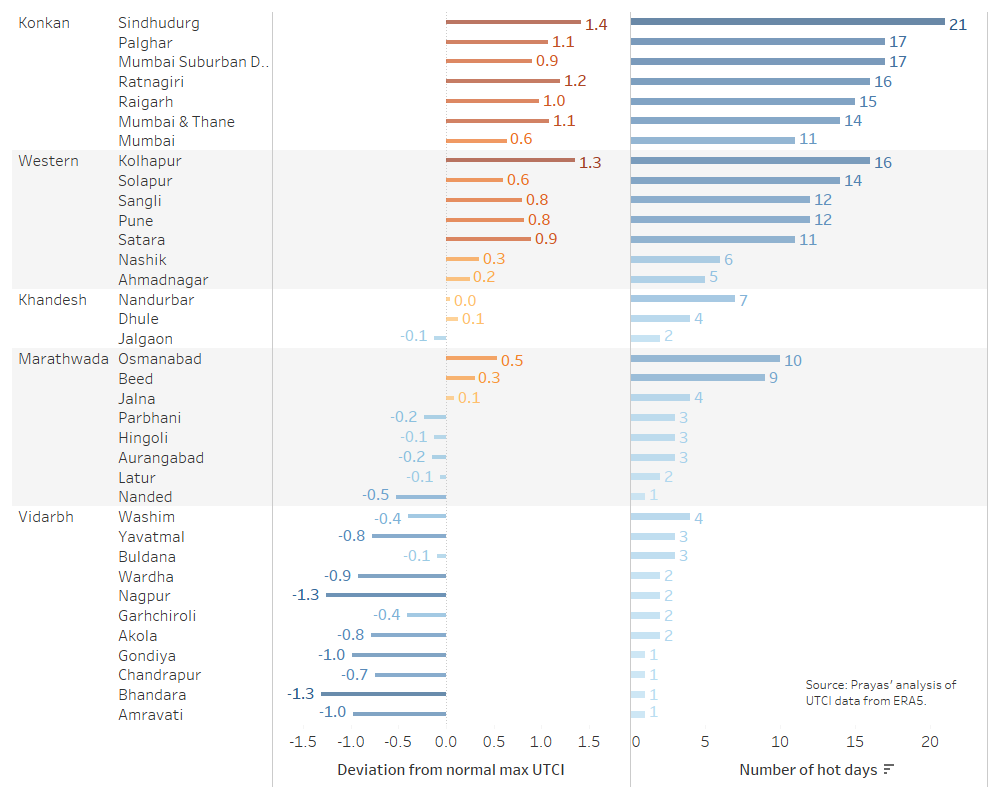
Figure 2: Daytime (maximum) UTCI patterns in Summer 2024
Hotter Nights Across the State
Nights were uncomfortably warm across the entire Maharashtra. The minimum UTCI values in all the districts in Maharashtra were higher than their 30 year averages (i.e. the normal minimum). On average, some districts in Western Maharashtra and Marathwada experienced nights with UTCI values as high as 2 degrees more than normal. Some districts like Palghar, Nashik, and Beed experienced 27-30 nights where UTCI values exceeded the 95th percentile criteria indicating extreme night time heat stress. It is important to note that these figures represent district-level averages over large geographical areas. Higher-resolution data could reveal even more severe localized heat conditions.
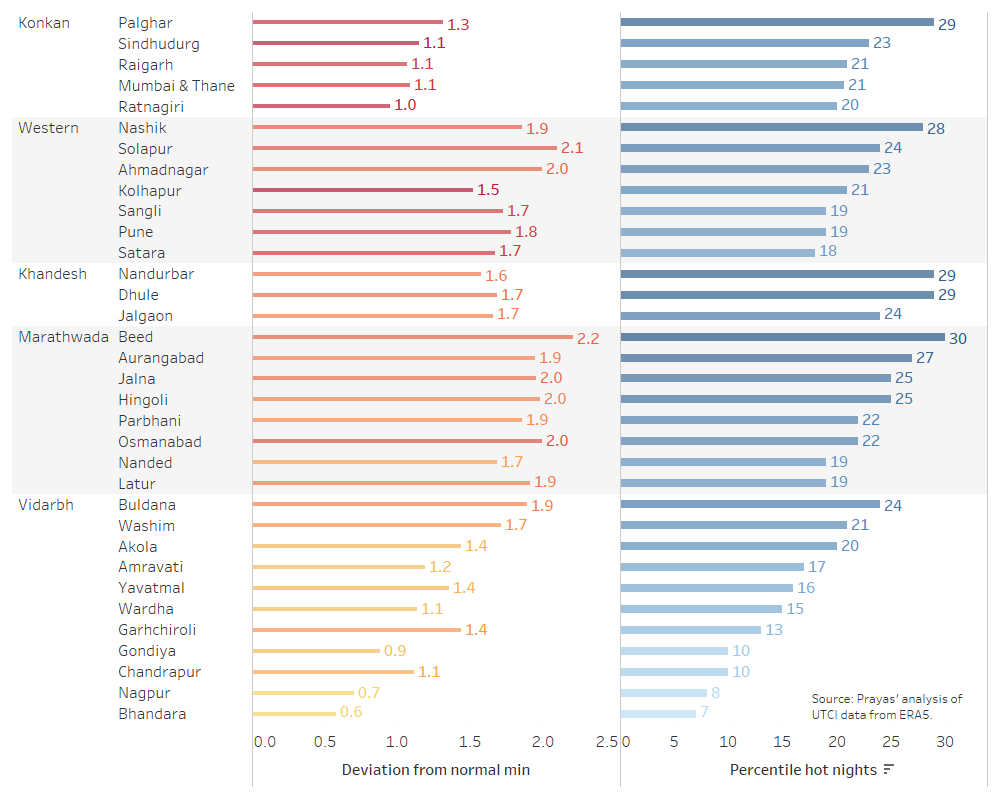
Figure 3: Night time (minimum) UTCI patterns in Summer 2024
Prolonged periods of continuous heat stress
Another concerning trend was the occurrence of prolonged heat stress, where consecutive hot days and nights persisted without relief. Many parts of Maharashtra experienced continuous heat stress for nearly 15 days in the second half of April. Konkan experienced an intense spell of heat stress, with nearly 7-10 consecutive hot days and nights. Prolonged exposure to such conditions seriously affects the body's ability to adapt, increasing the health risks.
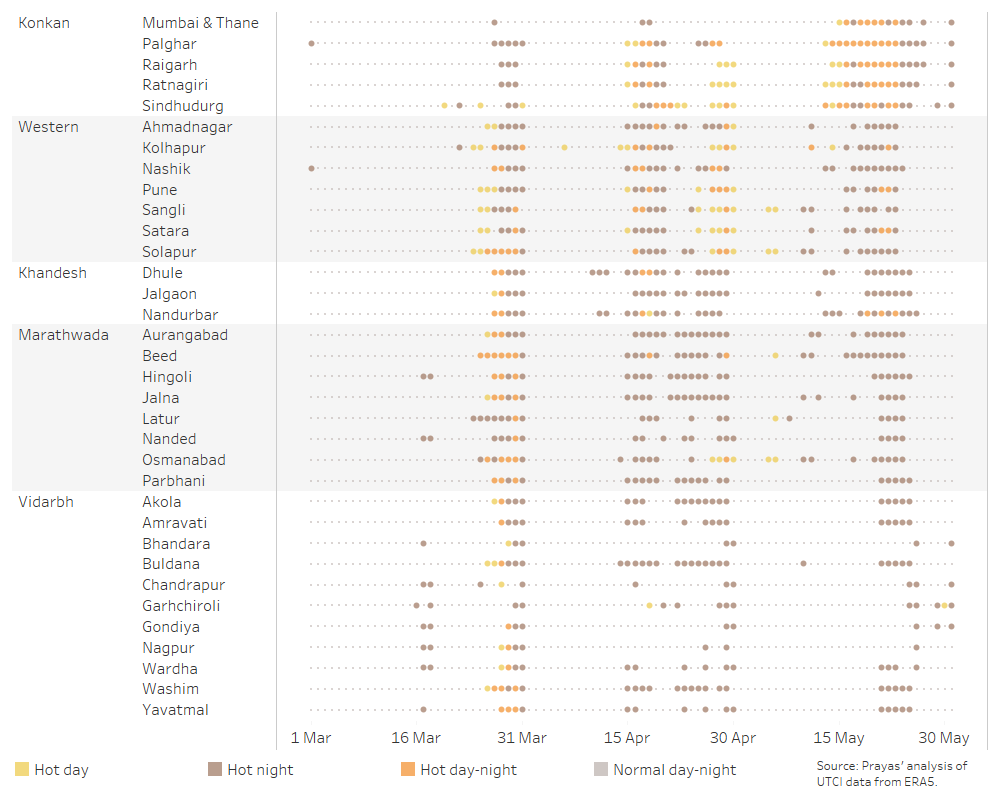
Figure 4: Consecutive heat-stress days in Summer 2024
In conclusion, our analysis indicates a rising trend in heat levels across the Konkan and Western Maharashtra regions—areas that have not traditionally been the focal point of heat stress discussions in Maharashtra. The increasing nighttime heat exposure across the state is particularly concerning, as it can exacerbate health risks, especially when coupled with prolonged periods of consecutive hot days and nights. We also emphasize the need for a locally tested heat index that better reflects health impacts and can be integrated into early warning systems. Additionally, it is essential for the IMD to make weather data publicly available in near real-time, either for free or at a reasonable cost. Access to timely and high-resolution data is crucial for improving the analysis of weather patterns and informing effective heat adaptation strategies.
Here is an interactive dashboard to explore our district level analysis of UTCI data. You can select a district by choosing the name from the drop down list on the right side of the dashboard . The interactive versions of the figures in this blog are also available in subsequent tabs.
|
The authors thank Shripad Dharmadhikary for reviewing the article. Please contact Aditya Chunekar (
|