
This is a blog series to present interesting insights from PIER (Perspectives on Indian Energy based on Rumi), our detailed energy systems model.
In the last blog, we took a detailed look at the outlook for coal demand in the current decade. In this post, we take a closer look at the residential electricity demand, focusing especially on the trends in space cooling demand as seen in the Reference scenario in PIER, since space cooling is an important energy service need in a tropical country like India. We shall also see how focusing on energy efficiency and consumer behavioural change can lead to surprising gains, providing for more residential energy services without increasing electricity demand.
Residential energy demand is projected in PIER by estimating (a) energy service needs for cooking, space cooling, refrigeration and lighting, (b) penetration of appliances at different efficiency levels to meet these service needs, and finally (c) the demand for energy from these appliances. Households are classified into 250 typical households by state, urban/rural and expenditure quintile and the estimation is done for each such household type.
Residential space cooling service demand in PIER
Space cooling service is met through 3 appliances in PIER – fan, cooler and AC. The amount of cooling service need is measured in cooling hours for fans and coolers and cooling degree hours for ACs. Cooling hours represent the number of hours the appliance is turned on, whereas cooling degree hours also incorporate the extent of cooling needed. This service demand is determined based on the ambient temperature and the temperature at which the appliance is turned on (called the trigger temperature), as well as the reference or set point temperature (at which room is to be maintained) for ACs. The ambient temperature is projected based on average monthly temperature projections from climate models and 2018 hourly temperatures from OpenWeather1. The trigger and set point temperatures depend on the monthly per-capita expenditure level of the household and, in the case of fans, the relative humidity of the location. Based on these inputs, the cooling service demand for each typical household is determined. Finally, in order to adjust for lesser occupancy of households during the day, the service demand during the day time is partially shifted to evening and night times.
Penetration of space cooling appliances
The probability of ownership and use of space cooling appliances for each typical household is projected over the model period using a logistic regression on the 2011-12 NSSO consumption expenditure survey data and is based on the location, expenditure quintile and electrification status of the households. The following table shows the penetrations of these appliances in FY21 and FY31 as a result of this regression.
| Rural | Urban | |||
| Appliance | FY21 | FY31 | FY21 | FY31 |
| AC | 1.4% | 7.9% | 8.8% | 25.4% |
| Coolers | 10.0% | 10.6% | 22.9% | 17.0% |
| Fans | 86.1% | 90.7% | 96.5% | 97.8% |
Appliance efficiencies
In the first year of the model, fans are assumed to have an average stock efficiency equivalent to a load of 70W. Given the policy push towards super-efficient fans which consume 35W or lower, the efficiency of new fan purchases is assumed to improve at a rate of 4% each year, which results in a 1% improvement each year in average stock efficiency. Stock efficiencies of coolers are assumed to improve at a rate of 0.5% each year. Since star labelling is mandated for ACs, 3 efficiency levels are assumed for the same, corresponding to 3, 4 and 5-star ratings, since these ratings make up a large share of AC purchases. The stock efficiency improvement per year are 1.24%, 1.58% and 2.54% per year for 3, 4 and 5-star ACs respectively.
Residential electricity demand by service
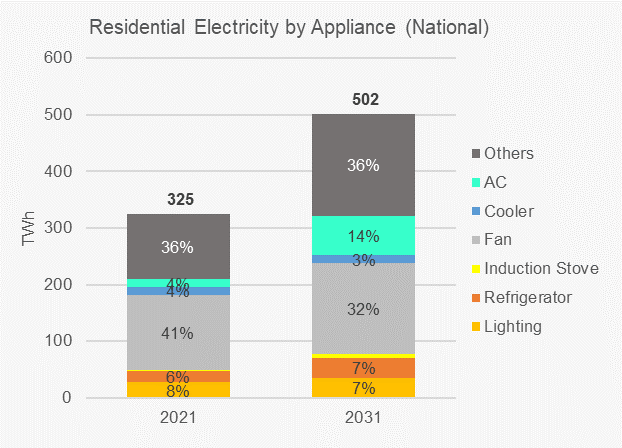
The figure below shows the residential electricity demand by appliance. The services that are not modelled in PIER are estimated as residual demand in the ‘Others’ category. As can be seen, space cooling appliances, i.e., fans, coolers and ACs, together account for about 50% of the demand throughout the model period. Fans are the single largest electricity consuming appliance, accounting for 41% and 32% of the total residential electricity demand in FY21 and FY31 respectively. Even though the fan’s share reduces, the electricity demand from fans grows from 133 TWh2 in FY21 to 161 TWh in FY31. The decrease in fan’s share is picked up by ACs, which grow from a share of 4% (13 TWh) in FY21 to 14% (68 TWh) in FY31, at a whopping 18% annual growth rate in electricity demand.
Contribution of space cooling demand to peak load
Space cooling appliances also contribute significantly to evening load, which is a period of stress in operating the grid, especially in a RE-rich system, due to simultaneous increase in household demand and decrease in solar generation. In FY21, when the annual peak is during summer evenings, cooling appliances (fans, coolers and ACs) together contribute as much as 26% of the national peak load. The contribution of cooling appliances to summer evening loads in FY31 remains roughly the same (25%), though by FY31, the annual peak shifts to mid-day of autumn and summer.
Role of energy efficiency
The Reference scenario reflects the most likely future of the energy sector from FY21 to FY31. As seen in our earlier blog, the optimistic recovery scenario (ORS), constructs a future based on a more optimistic recovery leading to higher GDP growth rates, increased spending and investment, reduced inequity and higher incomes. This leads to better purchasing power and greater demand for products. Greater investments lead to enhanced end-use and energy system efficiency, lower T & D3 losses, changed appliance ownership and use, and higher appliance efficiency.
A comparison of the results from ORS and Reference scenarios provides an interesting insight regarding the role of energy efficiency. Greater incomes – particularly among the poorer households – results in greater ownership and use of appliances in the ORS compared to the Reference scenario. Yet, despite this, residential electricity demand in FY31 actually reduces compared to the Reference scenario. This is because of two reasons – faster rate of improvement of efficiency due to advances in technology and a behavioural shift towards using more efficient appliances (i.e. 5-star and 4-star in preference to 3-star). Thus, in the ORS, the residential electricity demand in FY31 is only 484 TWh compared to 502 TWh in the Reference scenario, in spite of more appliances being owned and used. For example, 70 lakh more refrigerators, 60 lakh more ACs and 70 lakh more fans are used in FY31 in ORS as compared to the Reference scenario. This is shown in figure below.
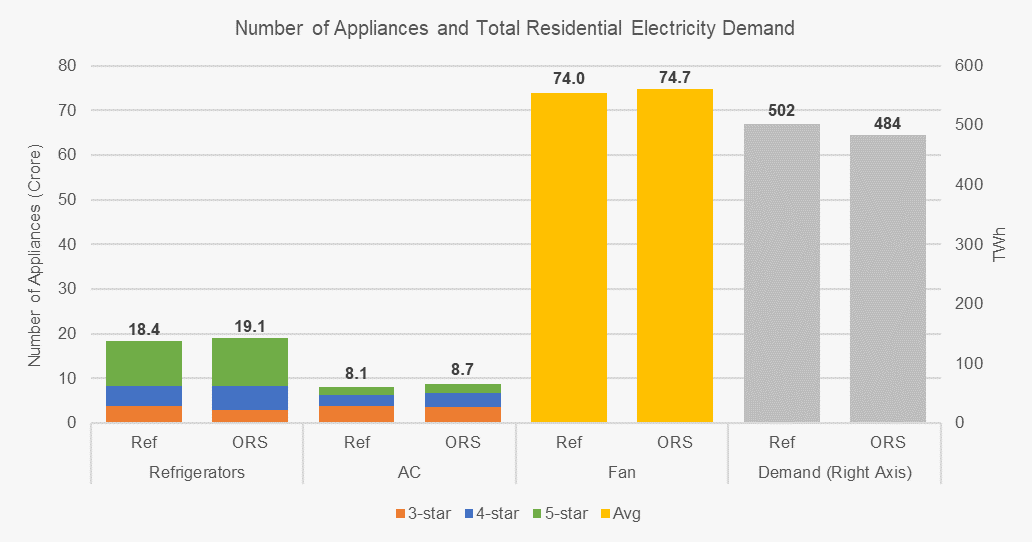
Note: 1 crore is equal to 10 million
The important insight emerging from this is that, with supportive recovery policies targeted at the poorer households and reviving investments, and concerted efforts to improve efficiency, it is possible to provide greater residential electricity services without increasing electricity demand.
Role of Consumer behaviour
Apart from appliance efficiency, consumer behavioural change can also be an important lever. In an interesting pair of contrary sensitivity runs, the trigger temperatures of a fan or cooler and the reference temperature of ACs are either increased or reduced by 2⁰C in all years, geographies and consumer types compared to the Reference scenario.
Increasing the trigger and reference temperatures by just 2⁰C, has a huge impact on the residential electricity demand. Compared to 502 TWh in FY31 in the Reference scenario, it is only 372 TWh – a huge drop of 25% in FY31 as seen in figure below. The overall peak load in FY31 also reduces from 323 GW in autumn middays in Reference scenario to 311 GW in summer middays in this scenario. The cumulative impact on the supply side is significant as well. Electricity generation at the bus-bar drops from 2455 TWh in FY31 in the Reference scenario to just 2298 TWh. As a result, the supply mix required to meet this demand is also quite different. It results in 24 GW lesser coal capacity and 6 GW lesser solar capacity in this case as against the Reference case. This is equivalent to having about 40 fewer coal-based generation units in the country, and represents almost a third of all new coal-based capacity installed in the Reference scenario.
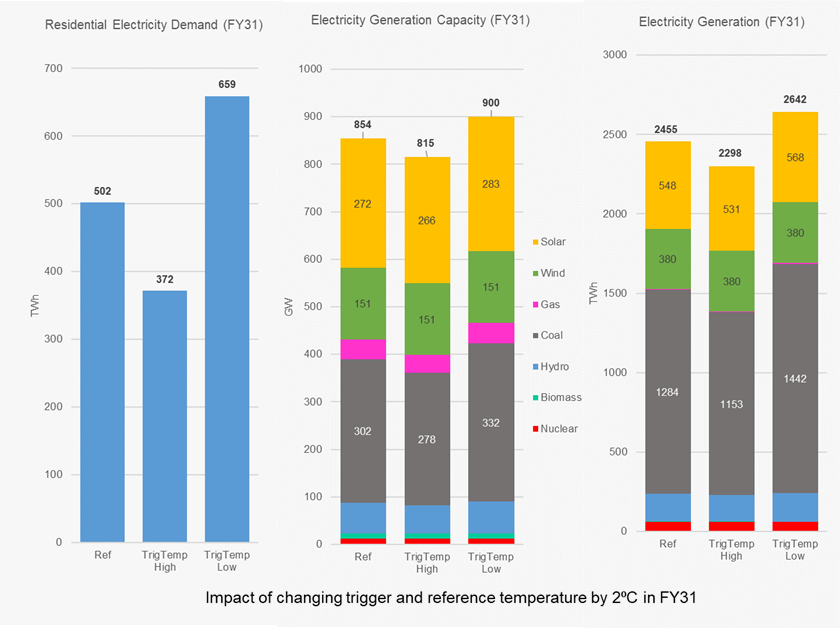
As expected, in the contrary run (when both trigger and reference temperatures are lowered by 2⁰C), the change is in the reverse direction. Residential electricity demand in FY31 balloons to 659 TWh in this run – about 31% more than the Reference scenario. The overall peak load in FY31 also increases to 336 GW in summer evenings. This leads to a significantly higher electricity supply (2642 TWh in FY31 instead of 2455 TWh) resulting in 30 GW more of coal capacity and 10 GW more of solar capacity compared to the Reference scenario.
We thus note how energy efficiency and influencing consumer behaviour can play an important role in terms of reducing overall capacity addition and shaving off peak load. Given that these can lead to significant savings in demand, the Bureau of Energy Efficiency (BEE), should improve implementation of its Standards & Labelling programme (refer our latest report ‘Watch the stars’), expand the programme to more appliances, revise the standards more frequently, and strengthen testing capacity. There is also a need to improve public awareness messaging to nudge consumers to buy higher star rated appliances, bring about behavioural change to use appliances more judiciously and implement a focused incentive for manufacturers to produce more efficient appliances. These measures can go a long way in reducing overall electricity demand and capital investment in FY31.
This blog focused on residential electricity demand, with specific attention to space cooling, and the importance of energy efficiency and consumer behaviour. In our next blog we shall touch upon an equally significant component of the residential energy mix – cooking.
|
Some relevant files from PIER Git repository
|
Endnotes
[1] https://openweathermap.org/
[2] Tera Watt hour
[3] Transmission and distribution