
This is a blog series to present interesting insights from PIER (Perspectives on Indian Energy based on Rumi), our detailed energy systems model.
In the final post of this blog series, we relate PIER estimates to different official targets, goals or projections by government agencies. In particular, we compare projections made by PIER in its Reference scenario with the following:
- Some targets and goals set by different energy ministries as part of the Vision 2024 exercise carried out in 2019-201
- The electricity demand projections for 2026-27 as part of the Electric Power Survey by the Central Electricity Authority (CEA)
- The electricity supply mix projected for 2029-2030 as part of the CEA optimal generation mix study2
- Some energy-related goals announced as part of the Prime Minister’s Panchamrit announcement at COP-26 in Glasgow3 and translated into India’s climate targets4.
Vision 2024 goals
As part of this process, the various energy ministries had come up with some goals for themselves to be achieved by 2023-24. These are presented in the following table, along with PIER projections for the same values for 2023-24. The following need to be kept in mind while interpreting this comparison:
- While the electricity related projections in PIER cover the entire electricity capacity and generation of the country, it is likely that the ministry targets are only for utility-contracted capacity and generation.
- It is not clear whether the ministry targets for generation are for net generation or gross generation. In this table, the PIER values given are for net generation.
- It is not clear if the coal import target represents just the quantity of coal, or quantity of coal at a particular calorific value. It is assumed to be just the quantity of coal for the purpose of this comparison.
| Item | Target | PIER projection | % difference |
| Installed capacity (GW) | 553 | 544 | -1.7% |
| Electricity generation (TWh) | 1867 | 1798 | -3.7% |
| Installed RE capacity (GW) | 225 | 170 | -24.5% |
| RE share of capacity (%) | 41% | 31% | -23.8% |
| RE share of generation (%) | 24% | 17% | -30.6% |
| Hydro capacity (GW) | 57.3 | 49 | -15.1% |
| Coal imports (MMT) | 124 | 196 | 58.4% |
Source: Government’s five-year vision document5 and PIER
Under the above assumptions, as can be seen, most of the targets will not be met by FY24, as per PIER projections. Since these government targets were set before the Covid-19 pandemic and PIER was built factoring in the impacts of Covid-19, it may be argued that the delays in achieving the target are due to the pandemic, though in some cases, the percentage of shortfall seems quite high.
CEA EPS and optimal generation mix
The CEA periodically produces an Electric Power Survey (EPS) that estimates electricity demand by state and consumer category, though this demand is estimated only for utilities (i.e., does not include captive and open-access consumers). The latest EPS, the 19th edition, was produced in 20176 and provides detailed demand projections up to 2026-27 and perspective demand for the years 2031-32 and 2036-37. The CEA used these demand estimates in a modelling exercise to identify an optimal supply mix for 2029-30 to meet this demand. We compare the PIER electricity demand projections for 2026-27 with the EPS demand projections for the same year, and PIER electricity supply mix projections for 2029-30 with the CEA optimal mix study projections. It should be remembered that the EPS projections, and hence the optimal mix findings, are only for utility electricity demand and do not include captive and open-access demand. The following comparison should be read keeping that in mind.
Electricity demand in 2026-27
As can be seen from the following chart, the national electricity demand projected by PIER in 2026-27 is slightly lower than that projected in the EPS (1678 TWh compared to 1743 TWh). This is despite the fact that the PIER projections include electricity demand from captive and open-access industry consumers, as reflected in the higher industry demand projection from PIER (686 TWh vs 520 TWh). This 166 TWh difference is more than made up by EPS projecting 100 TWh more of domestic (residential) demand, 65 TWh more of agricultural demand and 82 TWh more of ‘other’ demand. There is also a significant difference in the peak demand projected by EPS and PIER for 2026-27. EPS projects a peak demand of 299 GW while PIER projects only 264 GW. EPS also assumes a more aggressive reduction in T&D losses, resulting in electricity generation requirement of 2047 TWh to meet a demand of 1743 TWh, while PIER projects a generation requirement of 2024 TWh to meet a demand of 1678 TWh in 2026-27.
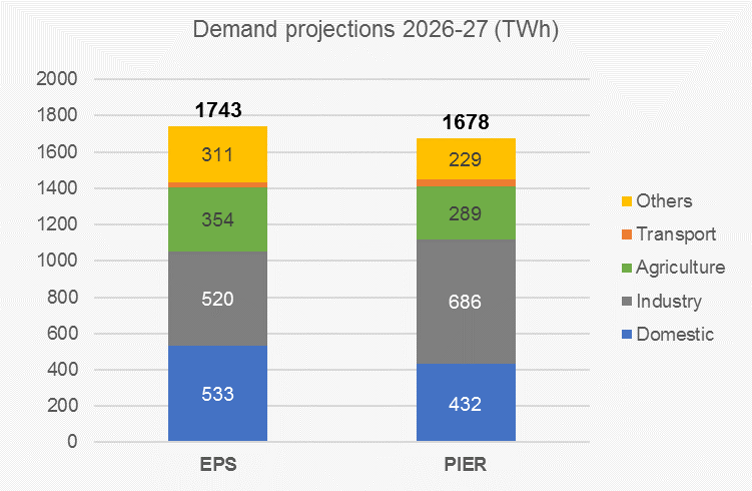
Source: CEA 19th EPS and PIER
Installed capacity in 2029-30
The CEA optimal mix study projects a total installed capacity of 801 GW in 2029-30, while PIER projects an installed capacity of 820 GW, though it should be remembered that the capacity in PIER is to meet the entire demand and not just utility-contracted demand. This is reflected in the higher installed capacity of coal (304 GW vs 267 GW) and gas (41 GW vs 25 GW) in PIER. The CEA optimal mix study discovers higher installed capacities for solar (280 GW vs 250 GW) and nuclear (19 GW vs 12 GW). These differences are likely due to the different cost assumptions and technical characteristics of these technologies assumed in these studies.
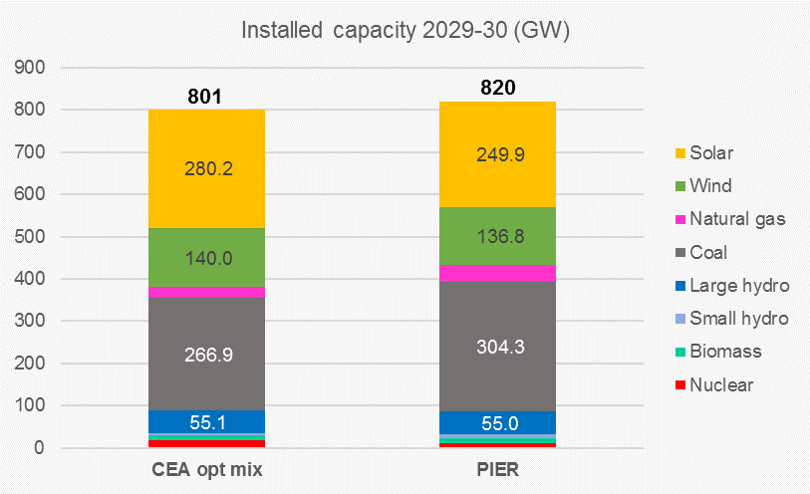
Source: CEA optimal mix report7 and PIER
In addition to the above, both the CEA optimal mix and PIER project storage installations by 2029-30. While CEA projects about 37 GW of storage (including pumped hydro storage), PIER projects about 20 GW.
Gross generation in 2029-30
The figures for gross generation by different generating technologies in 2029-30 for the two studies are shown in the following chart. Note that the two studies were trying to meet different demand values and demand shapes, as reflected in the different gross generation figures of the two studies (2513 TWh for the CEA study and 2441 TWh for PIER). This difference, along with the differences in technology costs and characteristics, results in the different generation profiles. In particular, generation from solar and wind is higher in PIER though the installed capacities are lower, while generation from coal and gas are lower though installed capacities are higher. There is also lesser hydro and nuclear generation in PIER.
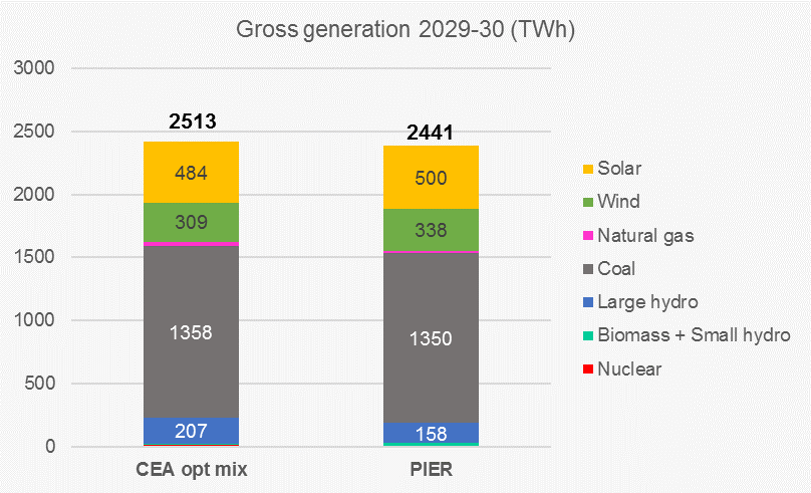
Source: CEA optimal mix report8 and PIER
Panchamrit announcement and India’s updated NDC
The Panchamrit announcement at COP-26 was part of the speech delivered by the Indian Prime Minister9, based on which the Union cabinet approved India’s Nationally Determined Contribution (NDC) to be communicated10. The following analysis is based on the two updated NDC commitments and one of the Panchamrit announcements which is not officially part of the NDC. This analysis assumes the following:
- The target year for the goals is 2030-31 (closest to the calendar year 2030)
- The goal of non-fossil energy capacity of 500 GW mentioned as part of the Panchamrit speech is interpreted as non-fossil electricity generation capacity of 500 GW
- The NDC related to reducing the emissions intensity of GDP by 45% with respect to 2005 levels (assumed to be 2004-05), is without considering emissions removed from the AFOLU sector, and considering GDP at constant 2011-12 prices.
- It is not clear whether the official targets only correspond to utility capacity and share, or the entire electricity sector. PIER projections for the entire sector are used for the comparison.
- Since PIER only models the energy sector, only energy sector emissions intensity has been considered. India’s 2005 energy sector emissions are not published in any official document. Hence the GHG Platform is used to obtain India’s 2005 energy sector GHG emissions11.
The parameters compared as part of this analysis are the share of non-fossil electricity generation capacity in the total capacity mix, the reduction in emissions intensity of GDP from the energy sector and the amount of non-fossil electricity generation capacity as announced in the Panchamrit speech. As can be seen from the following table, according to PIER, two of the three 2030 related targets – the ones related to non-fossil capacity and its share – would be achieved by India. According to PIER, the emissions intensity of energy sector emissions only reduces by 30%-38% compared to a target of 45%. This suggests that a greater share of reduction would perhaps have to come from other emission sources.
| Item | Target | PIER projection |
| Non-fossil fuel capacity (GW) | 50% | 60% |
| Reduction in emissions intensity of the economy (%) | 45% | 30%-38%12 |
| Non-fossil fuel capacity (GW) | 500 | 511 |
Conclusions
In this post, the final one of this series, we use PIER estimates to either assess if some of the government announced targets would be met, or to compare with some government projections. We find that the targets for 2023-24 will be hard to meet though it must be remembered that these targets were set before the Covid-19 pandemic. India is in a better shape to meet some of its NDC and climate related targets though, as the PIER report shows, they will require significant efforts. This analysis suggests that achieving the economy-wide emissions intensity reduction target is likely to require significantly greater contribution to intensity reduction from non-energy sector emissions.
This series of blog posts have highlighted some of the interesting features, findings and insights from the PIER modelling exercise. They have also pointed to some interesting policy possibilities regarding behavioural change, the impact of different recovery pathways from the pandemic and renewables capacity addition. We believe that a demand-oriented modelling exercise such as PIER is very critical to understand likely energy demand in future, and is an important component of planning for a development-focused low-carbon future for India. This approach of PIER is broadly on the lines of the approach adopted by the EDITS project. We are currently enriching both the Rumi platform as well as the PIER model in order to enable richer representation of the Indian energy system and derive better insights. We hope that readers of these blogs would also be encouraged to download, use, modify and enhance Rumi and / or PIER.
Endnotes
[1] https://coal.gov.in/sites/default/files/2021-01/vision_document.pdf and https://coal.gov.in/sites/default/files/2021-01/5-year-vision-ppt.pdf (accessed 21st June 2022)
[2] https://cea.nic.in/old/reports/others/planning/irp/Optimal_mix_report_2029-30_FINAL.pdf (accessed 21st June 2022)
[3] https://www.mea.gov.in/Speeches-Statements.htm?dtl/34466/National+Statement+by+Prime+Minister+Shri+Narendra+Modi+at+COP26+Summit+in+Glasgow (accessed 21st June 2022)
[4] https://pib.gov.in/PressReleaseIframePage.aspx?PRID=1847812 (accessed 4th August 2022)
[5] https://coal.gov.in/sites/default/files/2021-01/vision_document.pdf and https://coal.gov.in/sites/default/files/2021-01/5-year-vision-ppt.pdf
[6] The 20th EPS is under preparation and is likely to get published in this year (2022).
[7] https://cea.nic.in/old/reports/others/planning/irp/Optimal_mix_report_2029-30_FINAL.pdf
[8] https://cea.nic.in/old/reports/others/planning/irp/Optimal_mix_report_2029-30_FINAL.pdf
[9] https://www.mea.gov.in/Speeches-Statements.htm?dtl/34466/National_Statement_by_Prime_Minister_Shri_Narendra_Modi_at_COP26_Summit_in_Glasgow
[10] https://pib.gov.in/PressReleaseIframePage.aspx?PRID=1847812 (accessed 4th August 2022)
[11] http://www.ghgplatform-india.org/economy-wide (accessed 23rd June 2022)
[12] The lower and upper end estimates correspond to phase III and phase II 2005 energy sector emissions respectively, as reported in GHG platform.