
This is a blog series to present interesting insights from PIER (Perspectives on Indian Energy based on Rumi), our detailed energy systems model.
In the last post, we got an overview of India’s sector energy as it is likely to be in FY31 under the ‘Reference’ scenario in the PIER model. In this post, we look at various aspects of electricity demand and supply as modelled in PIER.
Electricity plays a significant role in the country’s energy sector, comprising roughly 20% of the end-use energy demand in FY21. This is likely to increase rapidly over the coming years with increased appliance use and with increased electrification of energy use in transport and industry.
Electricity demand projections in PIER
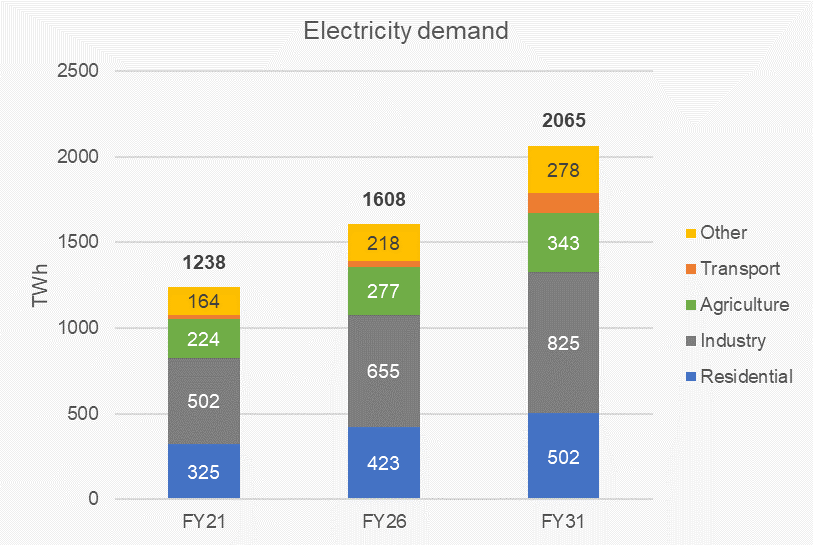
First, we look at the annual demand for electricity over the years, as estimated in the PIER Reference scenario. Electricity demand and supply in PIER include the demand met from both utility and captive sources. Total electricity demand is estimated to be around 1238 TWh in FY21, and increases by over 66% to 2065 TWh by FY31, at a compounded annual growth rate of 5.2%. The next chart shows the estimated electricity demand by sector between FY21 and FY31. Industry and residential demand continue to have the largest shares at 40% and 24% respectively in FY31. Electricity demand for transport grows the fastest at over 18% year over year, more than four times over the model period, though this is starting from a small base.
Load shapes
Electricity needs to be balanced instantaneously, hence electricity is balanced at a finer time granularity, i.e., seasons and day slices, as compared to the other energy carriers. Thus, load shapes and peak load are important considerations from the point of view of system balancing and capacity addition.
The next chart shows the day-slice-wise load pattern projected in the PIER Reference scenario in FY21 and FY31. The peak end-use electricity demand increases from 192 GW in FY21 to 323 GW in FY31. While the FY21 peak demand is during summer evening, this shifts to mid-day of autumn and summer by FY31. This shift of peak demand to mid-day is driven largely by the shift of agricultural load to day time and increasing day-time cooling load. The agricultural load shift is in line with the KUSUM1 program that aims to provide farmers with day time quality power with lower cost and relatively clean solar power.
As per these projections, the residential sector demand has a significant peak in the evening time slice and this is further accentuated in FY31. However, its impact on the overall demand is limited to summer and monsoon seasons due to the estimated load patterns of other demand sectors.
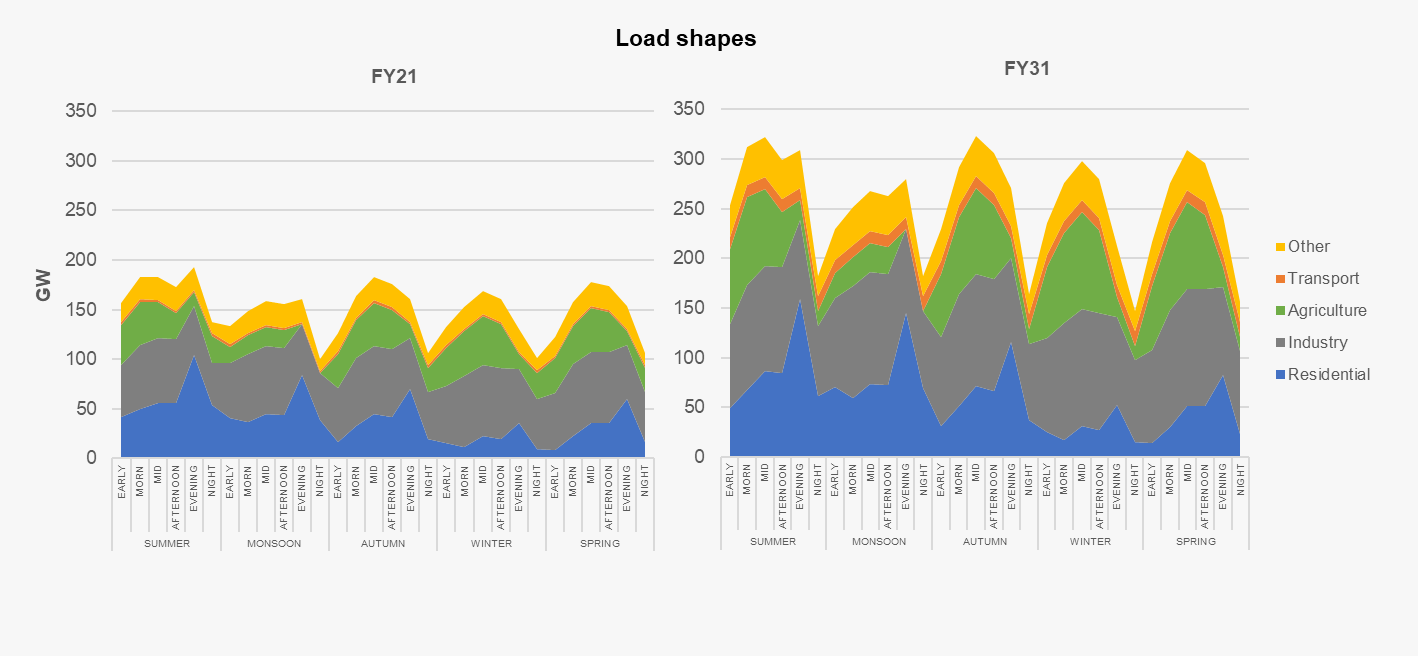
Note: The above figure shows load for day-slices (unequal in hours) for a typical day in a Season, and should not be read as a continuous ‘load curve’.
Capacity addition and generation trends
The supply module in Rumi optimises capacity addition to meet demand while minimising cost over the model period. Demand could remain unmet if that is the least cost option after considering the value of lost load input in the model.
The rapid changes in the economics of renewable electricity supply and storage technologies combined with the projections of electricity demand and load profile described in the previous section result in the least cost electricity supply mix discovered by the model. The next chart shows the technology-wise capacity and generation over the years in the PIER Reference scenario.
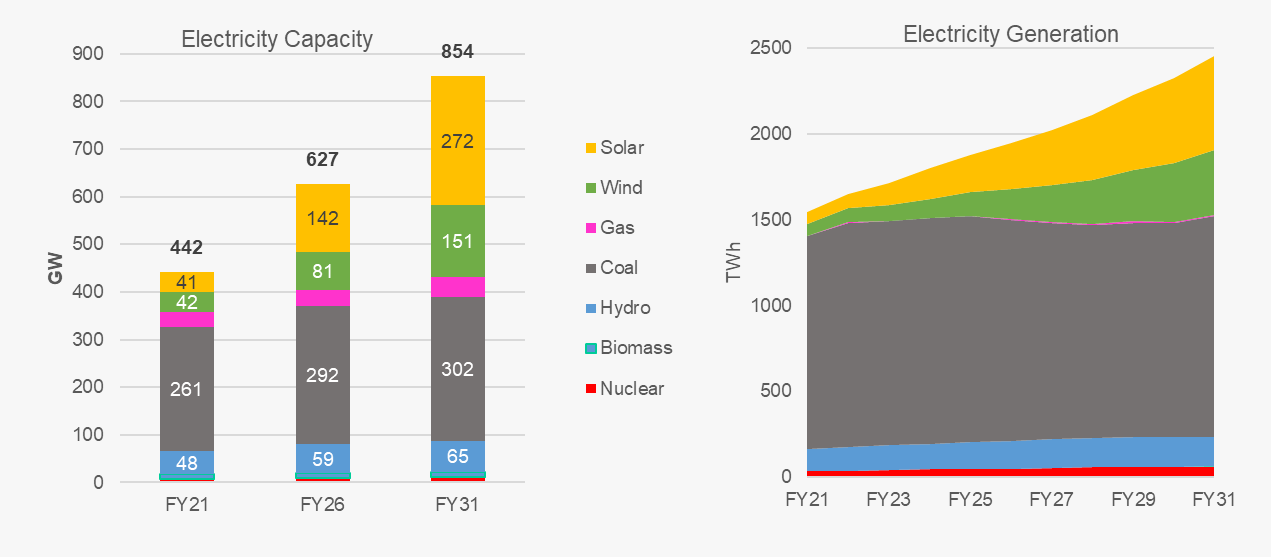
The total installed capacity including captive capacity nearly doubles from 442 GW in FY21 to 854 GW in FY31. Installed coal capacity goes up from 261 GW to 302 GW in the same period, with the share of coal in installed capacity falling from 59% in FY21 to 35% in FY31. During the same period, installed solar and wind capacity increase from 41 GW and 42 GW respectively to 272 GW and 151 GW respectively, taking their combined share up from 19% to 50%. This aggressive addition of solar and wind capacity to minimise cost results in 444 GW of renewables by FY31 – marginally short of the government target of 450 GW by 2030. However, this capacity addition is contingent on the feasibility of adding significantly higher solar and wind capacity in future years than has been done in the past – roughly 40 GW each year until the end of the decade.
Much of the solar and wind resource is geographically concentrated in the northern, western and southern parts of the country, hence almost all of the generation capacity addition happens in those regions. This generation capacity mix is supplemented by about 95 GWh of electricity storage (43 GWh of 4-hour BESS2, 28 GWh of 6-hour BESS and 24 GWh of pumped hydro), with almost all the BESS getting added in the last three years of the model as BESS prices drop.
In generation terms, supply of electricity at the bus bar increases from 1546 TWh in FY21 to 2455 TWh in FY31 at a CAGR of 4.7% p.a. in the Reference scenario3. This is lower than the 5.2% growth rate of electricity demand, owing to reducing T&D losses over time. Much of the increase in generation comes from solar and wind generation, whose combined share increases from about 9% in FY21 to 38% in FY31. Annual coal based generation remains more or less flat through the model period. While solar contributes to more than 50% during the morning and mid-day time slices in all seasons in FY31, coal based electricity still contributes more than 70% during the evening and night periods. Storage typically gets charged/pumped during the day and discharged during the evening time slice.
Electricity demand and supply across scenarios
Apart from the Reference scenario, the PIER model comprises two additional scenarios based on different recovery paths from the COVID-19 pandemic – one which charts an optimal recovery path (ORS) and another that takes a more pessimistic path (PRS). These scenarios differ in the pace of economic recovery, equity and other developmental parameters. Thus, GDP growth rates, household expenditures and consequently penetration of appliances and efficiencies are higher in the ORS, and lower in PRS. In this section, we take a look at the model projections across these scenarios.
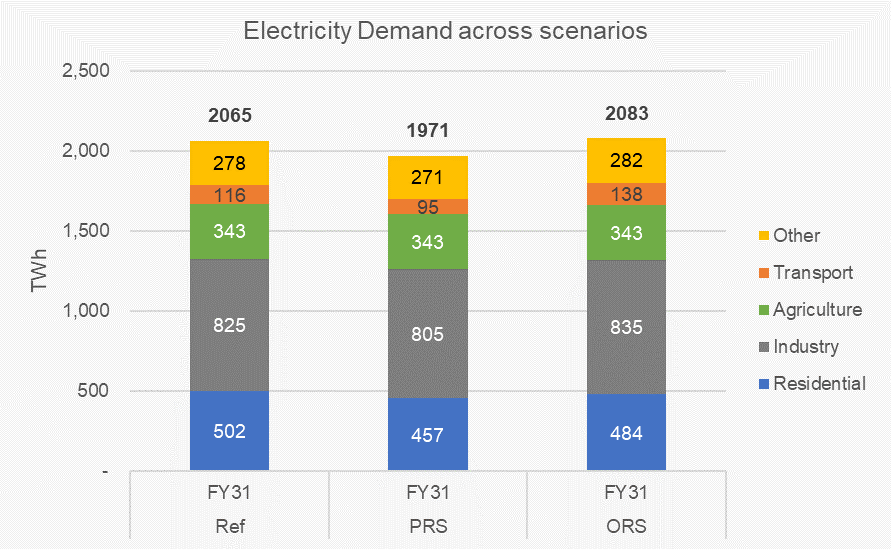
The next chart shows the overall electricity demand across scenarios. Electricity demand reduces to 1971 TWh in the PRS and increases to 2083 TWh in the ORS, as compared to 2065 TWh in the Reference scenario. Due to energy savings resulting from higher efficiency assumed in the ORS, demand in this scenario is only marginally higher than the Reference scenario. Owing to this, the residential sector demand is lower in both PRS and ORS as compared to the Reference scenario in spite of the fact that greater energy service need is met in the ORS.
On the supply side, different investment conditions considered in the two scenarios, combined with the changed demand profile results in differing electricity supply mixes. In the PRS, where electricity demand in FY31 is lower by 4.5% compared to the Reference scenario, installed generation capacity in FY31 is 22 GW lower than the Reference scenario. However, it results in 2.3 GW more installed coal capacity and 18 GW lesser installed solar and wind capacity in FY31 compared to the Reference scenario, given the constraints on investment. This results in a 3% increase in the per-unit cost of electricity in FY31 in the PRS compared to the Reference scenario. In contrast, in the ORS, overall capacity addition over the model period increases by 4 GW but coal capacity addition decreases by 4 GW while about 13 GW more of solar and wind get added.
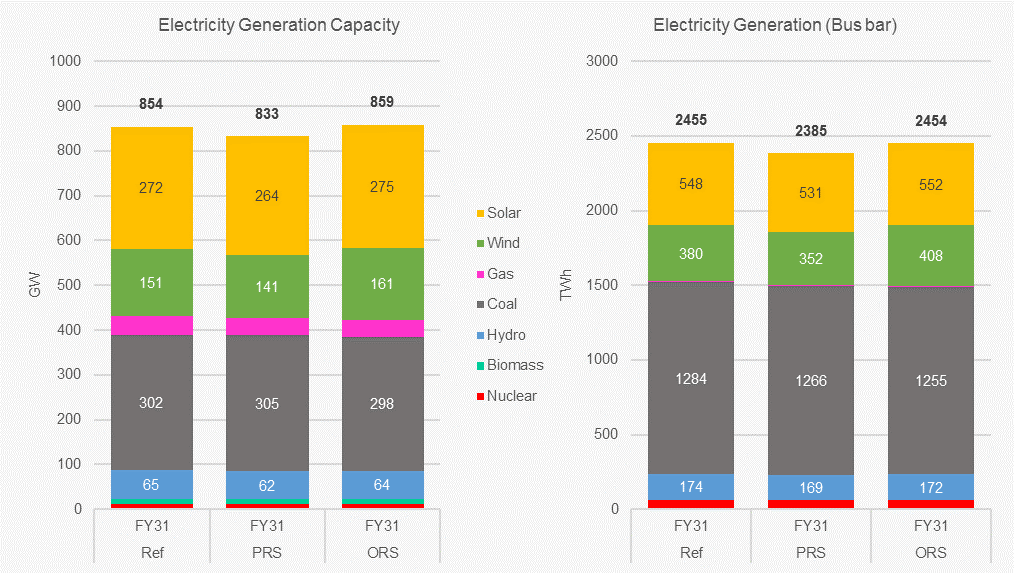
Due to efficiency of transmission and distribution, in the ORS, in FY31, the bus-bar generation is 1 TWh lesser than the Reference scenario even though demand at end-use is 18 TWh greater than the Reference scenario. Given the relative costs of the various technologies, the cost of supply per unit of electricity in the ORS in FY31 is 1.2% lower than the Reference scenario.
As indicated earlier, solar and wind capacity addition needs to be in the vicinity of 40 GW per year until FY31 in order to reach the target of 450 GW RE by 2030. This is four times the rate at which RE capacity addition has been happening in recent years. To investigate the impact of not being able to add RE capacity at such a fast pace, a sensitivity scenario was run with maximum allowed annual capacity addition of solar and wind restricted to half the value in the Reference scenario. This results in coal based capacity of 322 GW and generation of 1590 TWh by FY31 – over 20 GW (6.6%) and 300 TWh (~24%) higher than the Reference scenario. This highlights the importance of paying attention to supportive policies that enable the addition of adequate renewables capacity while being sensitive to local needs and issues, to avoid getting locked into excessive coal capacity that may become stranded.
As can been seen, coal is likely to continue to play an important role in the Indian electricity sector even as there is significant addition of renewables. In addition, coal is used for process heat among other things in industrial applications, making it hard to replace with low carbon energy sources. The next post takes a detailed look at the outlook for coal demand in the current decade emerging out of PIER.
|
Some relevant files from PIER Git repository
|
Endnotes
[1] See this page explaining the benefits of the solar feeder approach, and a Power Perspectives article on agriculture solar feeders in Maharashtra
[2] Battery Energy Storage System
[3] Generation at the bus bar is higher than demand since it includes transmission and distribution losses