
This is a blog series to present interesting insights from PIER (Perspectives on Indian Energy based on Rumi), our detailed energy systems model.
In the last blog, we looked at various aspects of electricity demand and supply in PIER under different scenarios. To cater to an increased demand for electricity, we are adding renewable capacity at a rapid pace. However, the electricity sector presently remains heavily coal dependent as over 70% of our electricity needs are being met by coal fired thermal power plants.
Coal types
Broadly, coal can be classified into coking and non-coking types. Coking coal is an essential input for the iron and steel industry while non-coking or steam coal is used in thermal power plants for generating electricity and in industry for heating purposes. Though India produces both coking and steam coal, almost all the ‘coking coal’ produced is in the lowest calorific value bands and predominantly used for power generation. Therefore, in our PIER model we have made a deliberate choice to model all Indian coal as steam coal1, and hence available for electricity generation and other steam coal uses, and all coking coal (i.e., the coal used for the steel industry) is assumed to be imported.
Coal share in end-use demand and primary energy supply
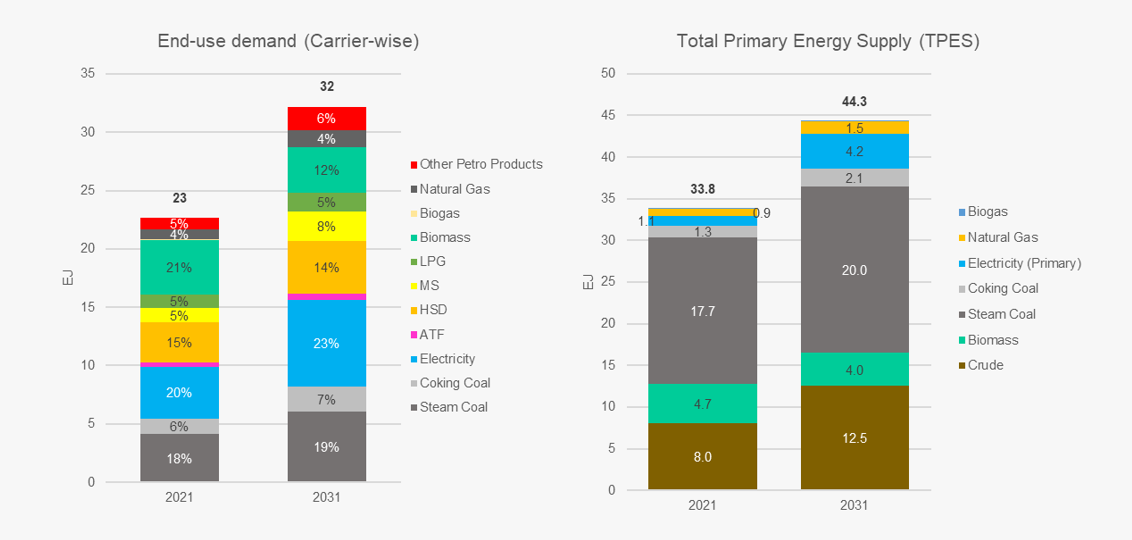
Nationally, end-use energy demand increases from about 23 EJ in FY21 to about 32 EJ in FY31, growing at 3.6% p.a. Even as the share of biomass reduces and electricity picks up to command a share of 23% in FY31, steam and coking coal together, still dominate and continue to maintain a share of around 25% in end-use energy demand over the model period as seen in Figure 1.
To cater to this rising demand, total primary energy supply (TPES) increases from about 33.8 EJ to 44.3 EJ in FY31. Through the model period, steam and coking coal remain the largest primary energy source in the country though their combined share goes down from about 19 EJ (56%) in FY21 to 22.1 EJ (50%) in FY31.
Figure 1: Share of coal in end-use demand and primary energy supply
Coal share in electricity
As seen in blog 2, installed capacity of coal thermal plants goes up from 261 GW in FY21 to 302 GW in FY31, with the share of coal in installed capacity falling from 59% in FY21 to 35% in FY31. The total electricity supply increases from around 1546 TWh to 2455 TWh by FY31. Electricity generation from coal remains largely flat, beginning from 1235 TWh in FY21 to reach a peak of 1313 TWh in FY25 and then marginally falls to 1284 TWh in FY31. Though the share of coal goes down from 80% in FY21 to 52% in FY31, it remains the single largest source of generation even in FY31.
From supplying about 10%-13% of electricity during the morning and mid-day slices in most seasons in FY21, solar generation contributes 50% and more during both these slices in FY31, with the share of coal in monsoon mid-day supply in FY31 falling to just 7.4%. However, given the diurnal and seasonal nature of generation of solar and wind respectively, coal remains the mainstay of supply at evening and night even in FY31, contributing to upwards of 70% of supply in most seasons till FY31.
PLF of coal capacity
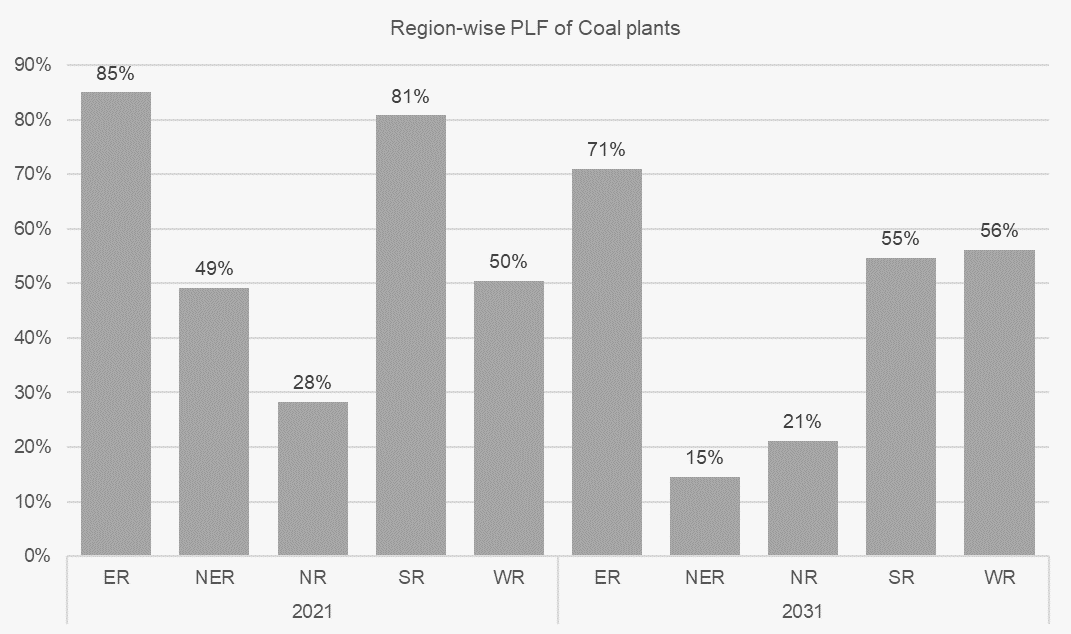
The relatively flat generation from coal over the model years combined with increasing coal capacity results in the plant load factor (PLF) of coal-based generation falling from about 59% nationally in FY21 to 53% in FY31. But there is significant regional difference in this. As seen in Figure 2, the coal fleet in ER, with its low coal transportation cost, has a PLF of 71% even in FY31 (and 85% in FY21). In the case of SR, though coal capacity increases (driven by those already under construction), generation actually decreases, resulting in PLF of SR’s coal plants falling from 81% in FY21 to 55% in FY31. Plants in NR and NER run on consistently low PLF’s during the model period, reasons for which need to be investigated.
Figure 2: Region-wise PLF of coal plants
Total coal demand and import dependence
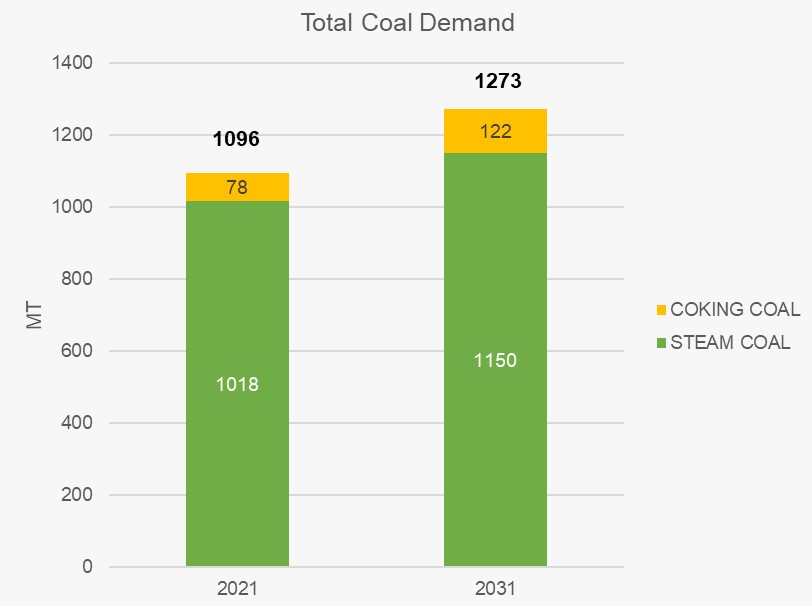
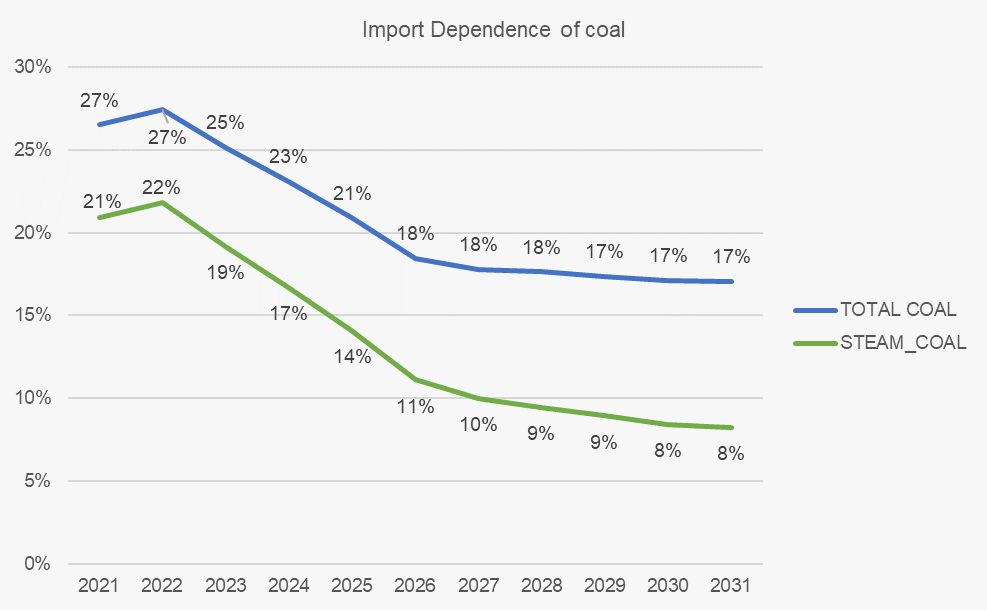
In FY21, about 290 MT2 (27%) of coal (both steam and coking) out of total requirement of 1096 MT is imported. By FY31, this falls to 217 MT (17%) out of a total of 1273 MT. For steam coal, the corresponding figures are 21% in FY21 reducing to just 8% in FY31. This is due to growing domestic production and relatively lower rate of demand growth despite the total demand for coal going up from 1096 MT to 1273 MT.
Figure 3: Total coal demand in 2031
Note: All quantities are in ‘domestic steam coal equivalent’ terms, i.e. at a calorific value of about 4150 kcal/kg
Figure 4: Import dependence of coal
Future coal capacity addition
As seen above, India needs about 302 GW of coal-based electricity generation capacity by FY31. This net addition of 41 GW roughly matches the capacity that would exist if all the capacity in the construction and permissions pipeline gets commissioned. Any fresh addition beyond that is risky and could lead to much longer lock-ins and stranded assets. However, this is contingent upon renewables capacity addition at a significantly higher rate than in the past as seen in previous blog.
Figure 5: Coal capacity addition under different scenarios
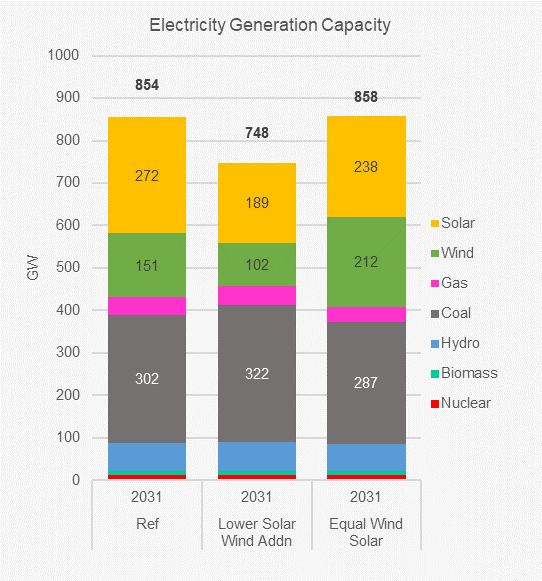
The scale of this challenge is highlighted by the results of the sensitivity run which examines the impact of being able to add only half the capacity of solar and wind annually as compared to the Reference scenario. In this case, since coal is the next best feasible option, there is significantly greater addition of coal capacity. Coal capacity in FY31 is now 322 GW – about 20 GW more than Reference case. Lower addition of renewables thus results in higher dependence on coal, increasing the PLF nationally to 61%. In another sensitivity run, when equal amounts of solar and wind capacity are permitted to be added, wind capacity expands substantially and combined solar and wind capacity reaches 450 GW in FY31. Total coal capacity required is only 287 GW in FY31, 15 GW lower than the Reference scenario with a lower PLF of 51% in FY31. So, a shift away from the present significantly higher emphasis on solar capacity, can potentially result in lower coal capacity addition in 2031. This highlights the necessity to focus attention on enabling the addition of adequate renewables capacity in the right proportion through supportive policies and business models.
Our next blog focuses on the residential electricity demand, particularly demand for space cooling and how consumer behavioural change can have a positive impact in reducing demand.
Endnotes
[1] This includes lignite or brown coal.
[2] These quantities are in ‘domestic steam coal equivalent’ terms, i.e. at a calorific value of about 4150 kcal/kg