
This is a blog series to present interesting insights from PIER (Perspectives on Indian Energy based on Rumi), our detailed energy systems model.
In the last blog, we looked at residential electricity demand with a special focus on space cooling and how it is impacted by appliance efficiency and consumer behaviour change. In this blog, we will take a deep-dive into one of the most important energy services in the residential sector viz. cooking.
India's various development imperatives like health, gender parity, and energy security, meet at the question of cooking fuel. The type of fuel used for cooking and other needs, greatly contributes in determining the health levels of India's women and children. According to the Global Burden of Diseases survey (GBD) 2019, about six lakh people die every year due to air pollution in Indian kitchens. Despite impressive strides made in increasing LPG connections to households, numerous large scale sample surveys (e.g. NSSO 2018 and NFHS-5 2019-21) show that over half of rural India still relies on solid fuels for its primary cooking needs. Therefore, it is pertinent to ask what will be the trajectories of clean cooking in India, in order to explore areas of improvement.
Let us look at how PIER models residential cooking. As discussed in the earlier blogs, PIER models 250 residential household types (25 ‘states’, 2 sectors- Urban, Rural and 5 expenditure quintiles in each).
We use logistic regression1 on NSSO’s consumption expenditure survey 2011-12 – no later representative data is available – to determine the primary fuel used by each of the 250 household types. For simplicity, our model currently assumes that a household only uses the primary fuel. The gains made in LPG connection penetrations due to the Pradhan Mantri Ujjwala Yojana, introduced in 2016, were approximated by using the NSSO’s 76th Round Drinking Water, Sanitation, Hygiene and Housing condition in India survey. The resultant penetrations for cooking fuels considered in PIER are shown in Table 1.
Table 1: National - Urban/Rural Penetrations of Cooking Fuels (primary)
| Energy service | Service Technology | Rural | Urban | ||
| FY21 | FY31 | FY21 | FY31 | ||
| Cooking | Biogas | 0.8% | 0.6% | 0.4% | 0.4% |
| Biomass | 53.4% | 36.1% | 9.1% | 3.3% | |
| Electric | 0.2% | 1.0% | 0.5% | 2.8% | |
| LPG | 45.6% | 62.2% | 85.2% | 83.8% | |
| PNG | 0.00% | 0.03% | 4.7% | 9.7% | |
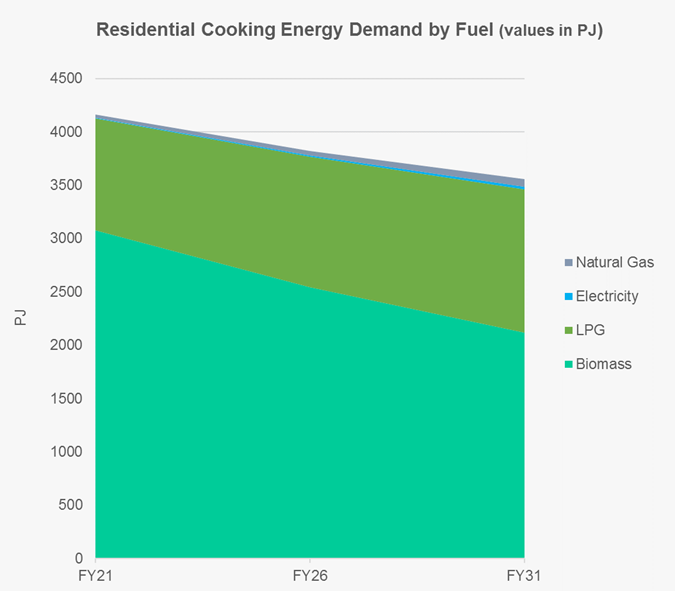
As seen in Figure 1, while biomass energy demand does decrease in the model period, it is still a significant fuel for meeting cooking needs in FY31 – consistent with the fact that 36% of rural households depend on biomass as the primary cooking fuel even in 2031, and that biomass stoves are highly inefficient. Even though electric cooking demand grows the fastest in our model (20% CAGR), its overall share in residential electricity demand continues to remain low (0.3% in FY21 to 1.2% in FY31) at the national level. On the other hand, LPG use for cooking increases significantly (from 25% in FY21 to about 38% in FY31) at a national level.
Figure 1: Residential Cooking Energy Demand by Fuel (values in PJ)
The Urban-rural divide continues
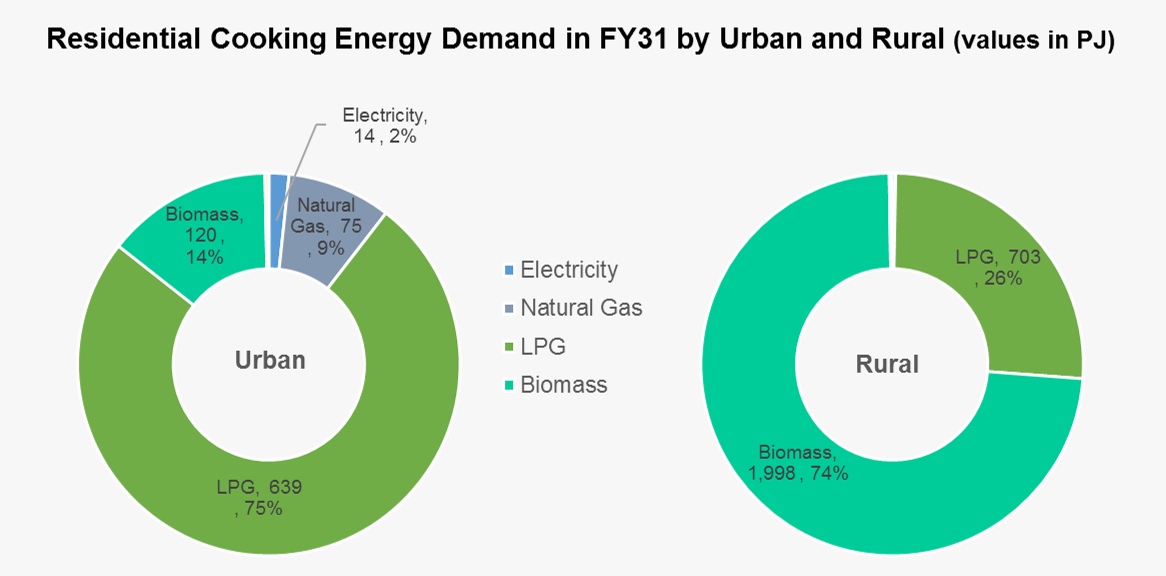
At the urban/rural level, it is quite evident from Figure 2 that the share of urban cooking energy demand met by LPG in urban areas is three times that of rural. Therefore more policy support for sustained adoption of LPG use in rural India is needed.
Figure 2: Residential Cooking Energy Demand in FY31 by Urban/Rural (values in PJ)
Progress, but limited to geographies…
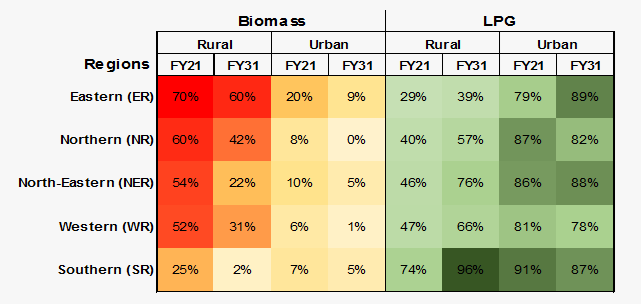
The bottom-up, granular nature of PIER model also enables us to look at regional disparities in residential cooking energy demand. As seen in Figure 32, while all regions see improvements in increasing LPG penetrations, Eastern and Northern rural regions see a rather muted growth in comparison to other geographies.
Figure 3: Biomass and LPG penetrations at Sub-geographies
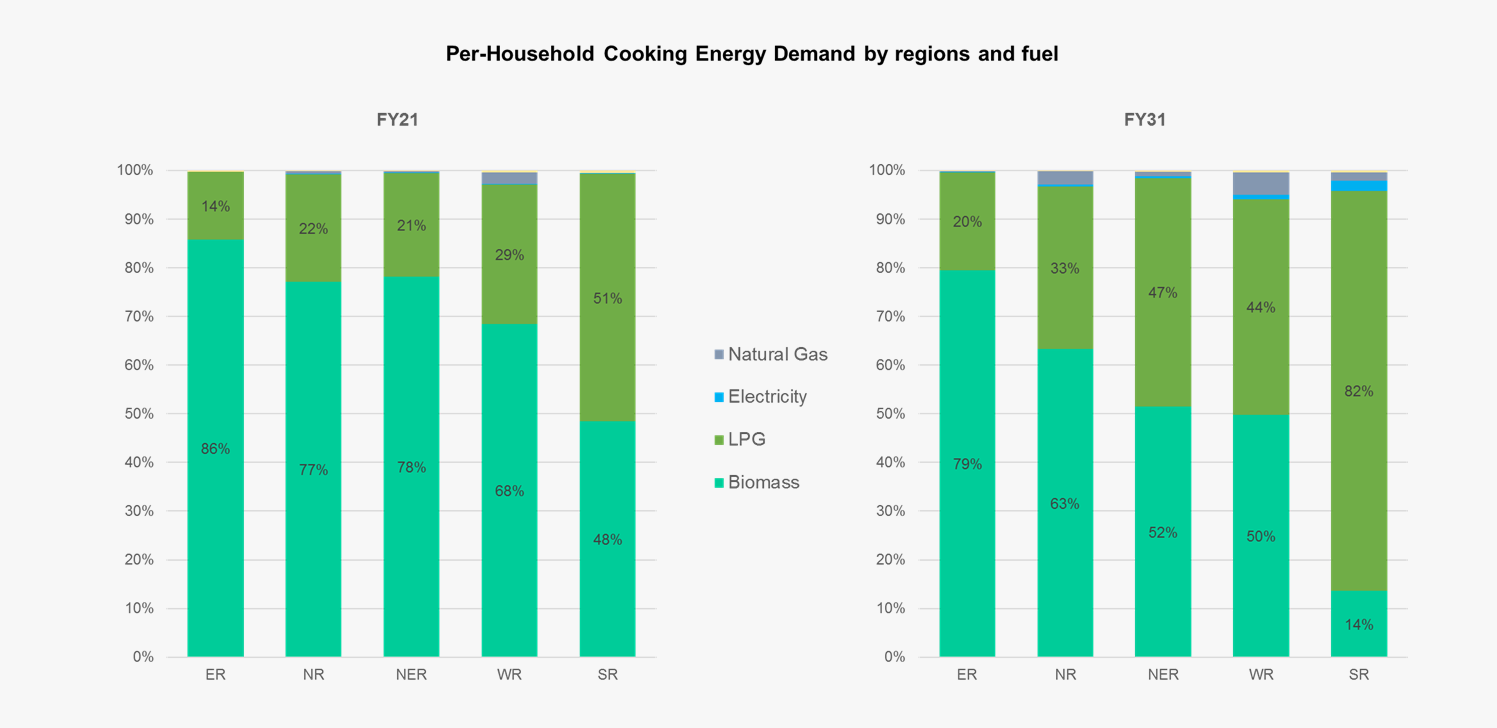
The resultant per-household cooking energy mix can be seen in Figure 4. Among the better performing regions is Southern region, which starts with the highest LPG cooking energy share among all regions in FY21 (~51%), goes on to increase its share to ~ 81%. Among the laggards, Eastern region stands out with only 14% LPG in per-household cooking energy in FY21 increasing to just about 20% in FY31. Therefore, it follows that while we have made significant progress in increasing LPG use, it is still limited to certain regions. Especially states in Eastern region (i.e Bihar, Jharkhand, Odisha and West Bengal in PIER) need a more targeted and sustained policy focus.
Figure 4: Per-Household Cooking Energy Demand by Regions and Fuel
The way forward
As we saw above, while there has been significant progress in increasing clean cooking fuel connections (mainly LPG) in rural India, sustained use eludes. Our model shows that not only is there a need to increase focus on use of clean cooking fuels in general, but increased policy support for domestic LPG for the rural and underserved consumers is of paramount importance – particularly in some regions. A few ways to increase the fuel mix in India’s rural cooking fuel would be:
- To urgently target, rationalize and enhance domestic LPG subsidy for vulnerable users (refer our policy brief and article)
- To put efforts in improving quality of service and supply (QoSS) through improved accountability and viability in the sector (refer our report ‘On the Back Burner’) and,
- To encourage behaviour change to move towards modern cooking fuels
In the final blog in the series, we will zoom out of the residential sector and compare some of PIER estimates with government projections and assess the status of previously announced targets with PIER results.
|
Some relevant files from PIER Git repository
|
Endnotes
[1] For more details, refer to Section A2-Residential sector energy demand of the PIER report
[2] Please note that only the dominant modern fuel LPG is shown here for ease of comparison. The reducing LPG penetration in urban corresponds to a consequent increase in other modern fuels Electricity, PNG which is not shown here.