
This is a blog series to present interesting insights from PIER (Perspectives on Indian Energy based on Rumi), our detailed energy systems model.
The energy sector is a vital component of India’s economy. Moreover, as the sector predominantly responsible for emission of climate-changing greenhouse gases, it is also the subject of significant policy attention. The rapidly changing technological landscape is also driving transformation in the sector. For all these reasons, it is important and interesting to understand the possible futures of the country’s energy scenario. Energy models are the tools used to provide insights into future energy scenarios. The PIER model built on the Rumi platform which is demand-oriented, open-source and open-data is one such model which projects India’s energy demand and supply scenarios from 2020-21 to 2030-31. This blog series presents some of the interesting insights and findings from PIER. The report about PIER and Rumi available on the PIER model page gives detailed information about the assumptions, methodology, results and insights1. This is the first blog post in the series and presents an overview of the Indian energy system as it is likely to be in 2030-31 under the ‘Reference’ scenario modelled in PIER representing the ‘most likely’ future.
In this version of PIER, the end-use demand for energy is modelled in detail for the residential sector, and more approximately for other sectors such as industry and transport which will be detailed out in a forthcoming version. Some details of the residential sector model and insights from it are presented in subsequent posts. Demand for industrial energy use and conventional transport fuels are modelled using GDP elasticity2.
India’s end-use demand for energy
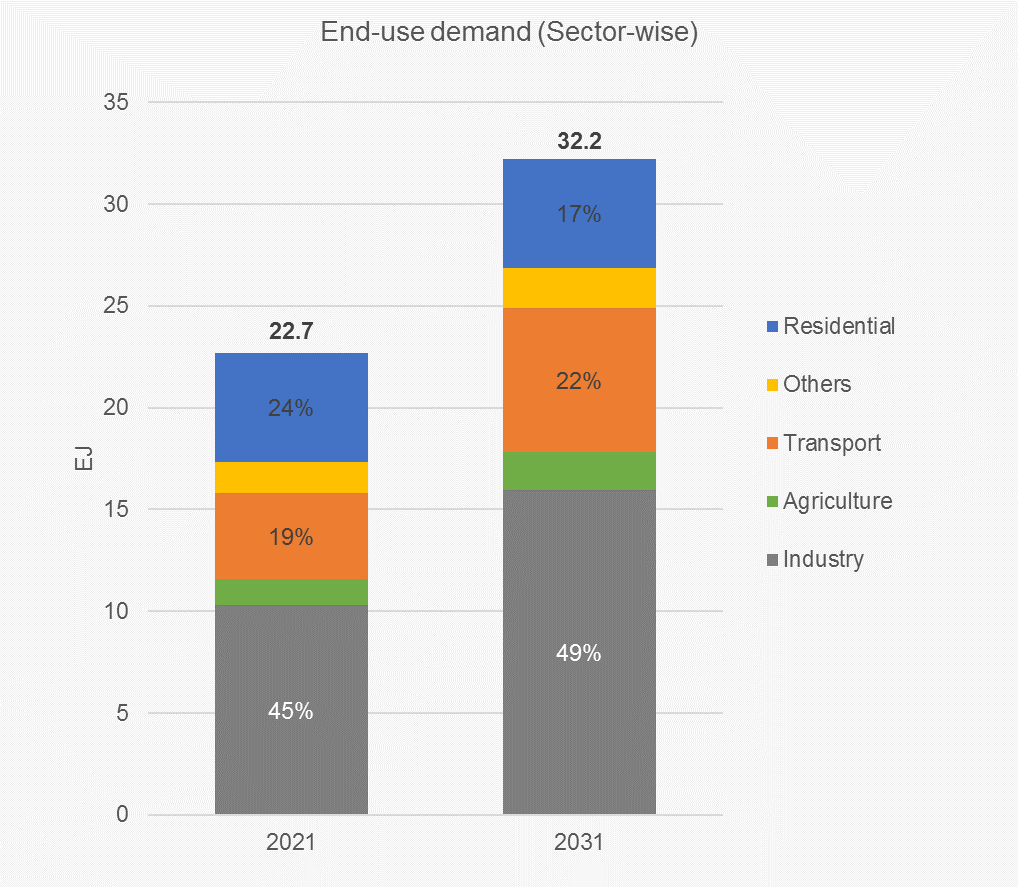
India’s energy demand increases from 22.7 exa-joules (EJ) in FY21 to 32.2 EJ in FY31. This corresponds to demand increasing at 3.6% per annum. For a growing economy such as India, this may seem like a relatively low growth-rate. This is because energy efficiencies consistently improve over the years, which means that the same energy service can be provided by lesser energy. This is either due to improved technical efficiency (e.g. more efficient ACs, vehicles and industrial processes) or switching to an entirely different technology which is much more efficient (e.g. using LPG instead of biomass for cooking).
Sectorally, industry accounts for the bulk of end-use demand with its share increasing from 45% in 2020-21 to 49% in 2030-31. But the sector with the fastest rate of growth in energy demand is the transport sector which grows at 5.3% p.a. to have a share of 22% by FY31. Interestingly, in spite of increasing incomes and usage of electrical appliances, residential energy demand remains nearly constant over the years and its share in the energy basket reduces – mainly because of the switch away from highly inefficient biomass to more efficient forms of cooking.
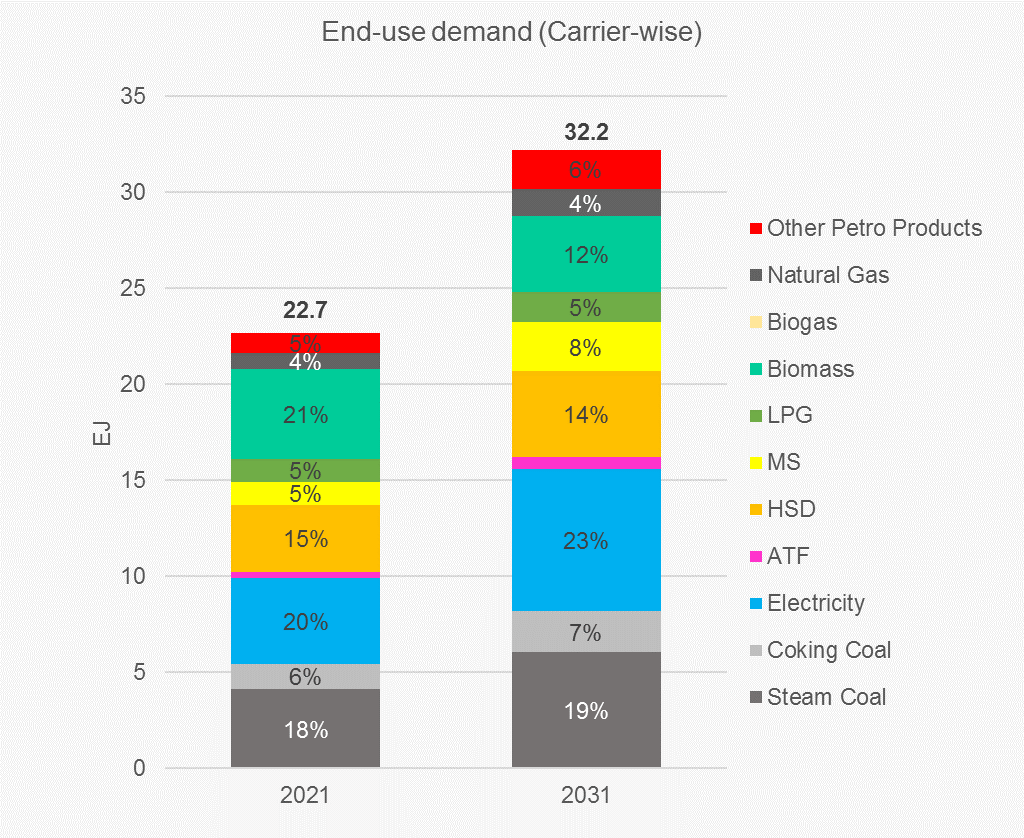
All petroleum products together account for about a third of the total end-use energy demand in the country over the years, while coal accounts for about a quarter. As households shift away from biomass, its share falls from 21% to 12% of the total end-use energy demand though this too is quite high. The share of electricity in final end-use demand increases rapidly over the years from 20% in FY2021 to 23% in FY2031, with increasing electrification of various sectors and increased appliance usage in households.
Where does this energy come from?
Energy has to be supplied in order to meet the end-use demand. Since there are losses involved both in energy supply (i.e. transmission and distribution) and in energy conversion (producing one form of energy from another), the required energy supply is more than energy demanded. Thus, India’s total energy supply increases from 33.8 EJ to 44.3 EJ over the model period in PIER. This represents a growth rate of 2.75% p.a. There are two reasons why this growth rate is lower than the growth rate of demand. One is the increasing efficiency of energy conversion (e.g. coal-based electricity generation) and supply (e.g. reducing losses in electricity transmission and distribution). The second is an increasing share of electricity from renewable sources, which are typically not considered to have any conversion losses – the growth rate of such electricity supply being 14.1% p.a. compared to the 2.75% p.a. increase in total energy supply.
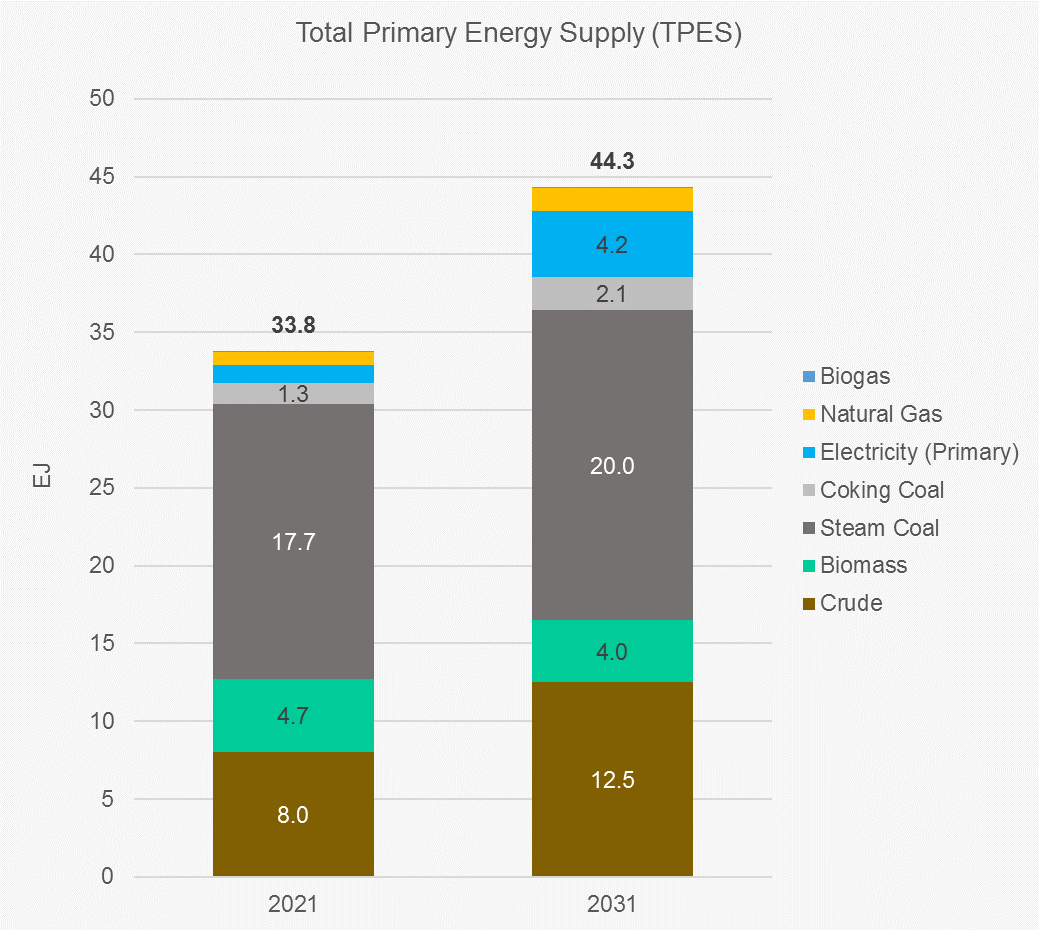
Coal remains the dominant source of primary energy supply in India. Steam and coking coal together account for half of India’s primary energy supply even in FY2031, down from 56% in FY2021. The rapid growth of electricity generation from renewable sources does not dent the dominance of coal by much for two reasons: one, electricity plays a relatively small role (20-25%) in total end-use energy demand, and the rapid growth of renewables in electricity is from a very small base.
Among the other energy carriers, as expected, the usage of biomass falls over the years with its share coming down to 9% from 14%. These results also suggest that, while the use of natural gas grows fast at about 5.5% p.a., its share in the total energy supply is likely to remain modest at about 3.3% in FY31. Thus, India is unlikely to achieve the sometimes-quoted aspiration of 15% of its energy supply coming from natural gas. The requirement of crude oil increases by more than 50% over the model period, going up from 8 EJ to 12.5 EJ, mainly due to increasing transport fuel demand. This rapid growth in crude oil & natural gas requirement combined with tepid domestic production, leads to import dependence increasing from 83% to 88% for crude oil and from 14% to 39% for natural gas3.
Over this decade, India’s per-capita energy requirement (i.e. total energy supplied per-capita) goes up from 605 kilograms of oil equivalent (kgoe) in FY2021 to about 714 kgoe in FY2031, reflective of a growing economy with increasing energy usage in households and for various purposes such as transport and industry. While this is a welcome development, India’s per-capita energy consumption in FY2031 still remains well below the global average in 2020 in the Reference scenario, as can be seen from the following chart.
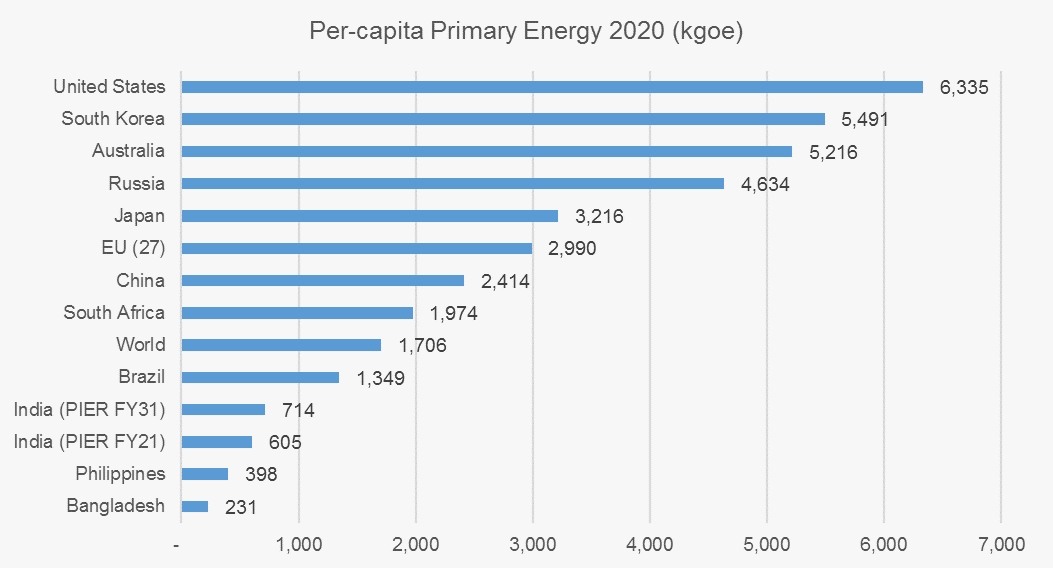
Note: The per-capita primary energy for all countries other than India in this chart are 2020 values taken from Our World In Data (https://ourworldindata.org/grapher/per-capita-energy-use). As indicated, the India values are for FY21 and FY31 from PIER
The ongoing energy transition is taking place the fastest in the electricity sector where the prices of renewables have fallen rapidly and it is expected that the prices of (battery-based) storage will also fall similarly in the coming years. Moreover, a thrust towards electric mobility and increased electrification of industrial processes and agricultural pumping may increase electricity demand. This makes the contours of the electricity sub-sector within the larger energy sector interesting to study. The next blog in this series looks at the electricity sector modelled in PIER in greater detail.
Endnotes
[1] The source code of Rumi and data used for PIER are also available for download.
[2] Annual GDP values are projected based on reports from the Reserve Bank of India and the International Monetary Fund, which results in GDP growing at 6.9% p.a. on average over the model period. GDP elasticity of energy demand is based on historical trends, adjusted for improvements in energy efficiency.
[3] Note that PIER only models natural gas use in the energy sector, though it is also used as feedstock in the fertilizer sector.