
Insights from smart metering data
eMARC is an initiative by Prayas (Energy Group) to provide insights on electricity consumption in Indian homes. Under eMARC, minute-wise data related to electricity consumption is collected using smart meters from a sample of households and appliances. Interactive dashboards based on the analysis of this data are available on the eMARC website. In this blog series we present key observations based on the data collected from 115 households from January 2018 to June 2020. The households include urban households from Pune City and semi-urban and rural households from the districts of Pune, Aurangabad, Kanpur Rural, and Gonda. In this post we present the insights on the quality of electricity supply received by the sample households.
Please read this post for details on how emarc works and the description of our sample.
Key takeaways
- Households in Pune city received close to 24 hours of electricity supply on an average whereas the number was 23 and 22 in Pune and Aurangabad districts and 17 and 18 in Kanpur Rural and Gonda districts respectively.
- Significant variation in the quality of electricity supply observed particularly in the semi-urban and rural areas of all the four districts.
- Supply hours were observed to be the lowest in the monsoon months, and highest during winter months.
- Most of the outages were observed to occur in the late morning and afternoon hours.
Quality of electricity supply is crucial for the use of appliances by the households. Frequent, long, and unpredictable power outages reduce the utility of appliances. Households that can afford to invest in generators or inverter-battery systems do so, resulting in a significant increase in their overall cost of the use of electricity. Furthermore, supply of electricity outside the prescribed voltage limits can damage the appliances and also pose a safety risk. For instance, induction motors commonly used in refrigerators and air-conditioners may overheat and fail if used at lower voltages, and electronic components may be damaged when used at higher voltages. Prolonged voltage variations and sudden surges damage electrical equipment and prompt the consumers to invest in protective equipment such as voltage stabilizers and surge protectors. Thus, poor quality of electricity supply results in restricted use of appliances as well as increased costs of running the appliances. In this post we detail the observations of supply quality from urban, semi- urban and rural locations in our sample where different levels of economic activities impact the performance of the local distribution networks. Demographic details of each of the districts have been detailed in this post.
Hours of supply
The daily hours of electricity supply received by the eMARC households during the analysis period varied across regions. On an average, the households in Pune city received close to 24 hours of electricity supply. Households in Pune and Aurangabad districts received electricity for little more than 22 hours on an average while those in Kanpur rural and Gonda districts received electricity supply for 17 and 18 hours a day respectively. However, as can be seen in Table 1, the supply hours vary with individual households locations even within a region. This is particularly so in the semi-urban and rural areas and not much in Pune city. A similar trend is also observed in our Electricity Supply Monitoring Initiative (ESMI) in similar regions of the states of Maharashtra and Uttar Pradesh.
| Region | Average | Median | Minimum | Maximum |
| Pune City | 23.8 | 23.8 | 23.6 | 23.9 |
| Pune | 22.5 | 22.7 | 21.2 | 23.4 |
| Aurangabad | 22.2 | 22.9 | 17.9 | 23.5 |
| Kanpur Rural | 17.2 | 18.2 | 11.0 | 21.8 |
| Gonda | 18.1 | 18.4 | 14.2 | 22.0 |
Table 1: Variation of average daily electricity supply hours within the sample
The hours of supply also vary across seasons as seen in Figure 1. The trend in seasonal variation was similar across regions, although the actual number of supply hours differed greatly. Monsoon months received the lowest hours of supply, and those in the winter months were generally higher than other months. This observation corroborates responses of the household survey, where most households reported increased electricity supply outage during monsoon months.
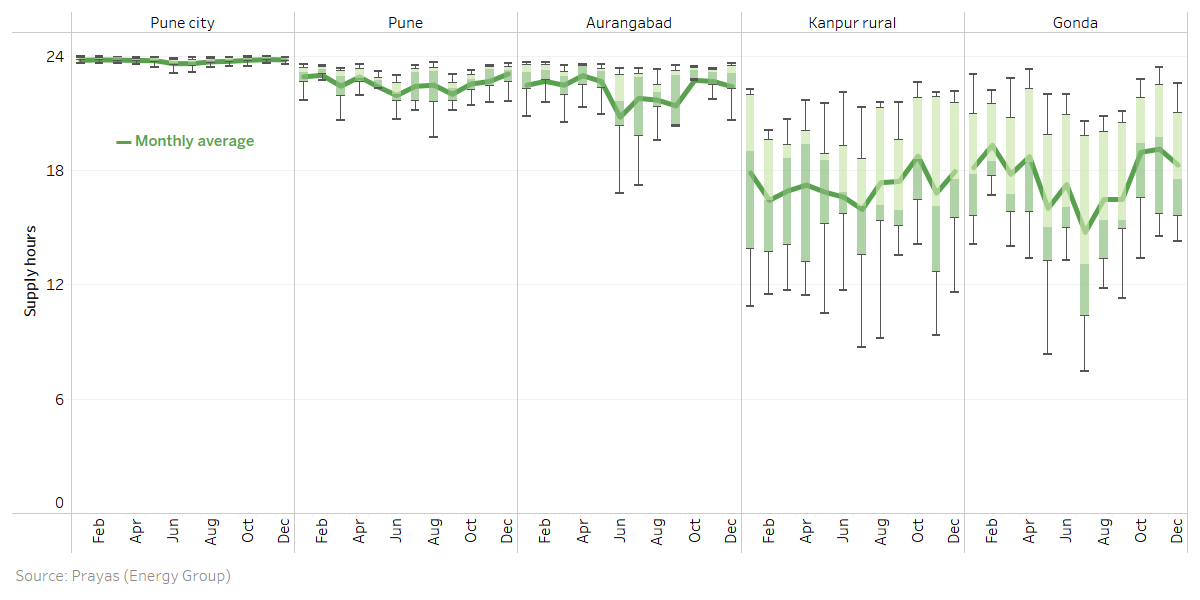
Figure 1: Seasonal variation of the supply hours in the sample.
Supply voltage levels
As mentioned earlier, the voltage at which the electricity is supplied is equally as important as whether it is supplied or not. Several state electricity regulatory commissions (SERCs) prescribe a reference voltage level at the consumer end with a tolerance band in its supply code regulations. For instance Maharashtra SERC prescribes a reference voltage of 230 V with 10% permissible variation. We classified the recorded minute-wise voltage readings into no supply, low, normal, and high voltage, as shown in Figure 2. We also accounted for the accuracy of the voltage measurements by eMARC devices to determine these bands.
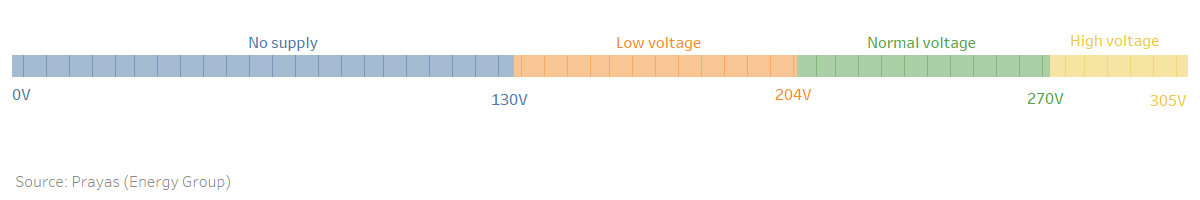
Figure 2: Voltage classification of recorded minute-wise supply
As with the supply hours, the quality of electricity supply also varied across regions and households. Figure 3 shows average supply voltage levels received by the eMARC households, based on all available and valid data during the analysis period.
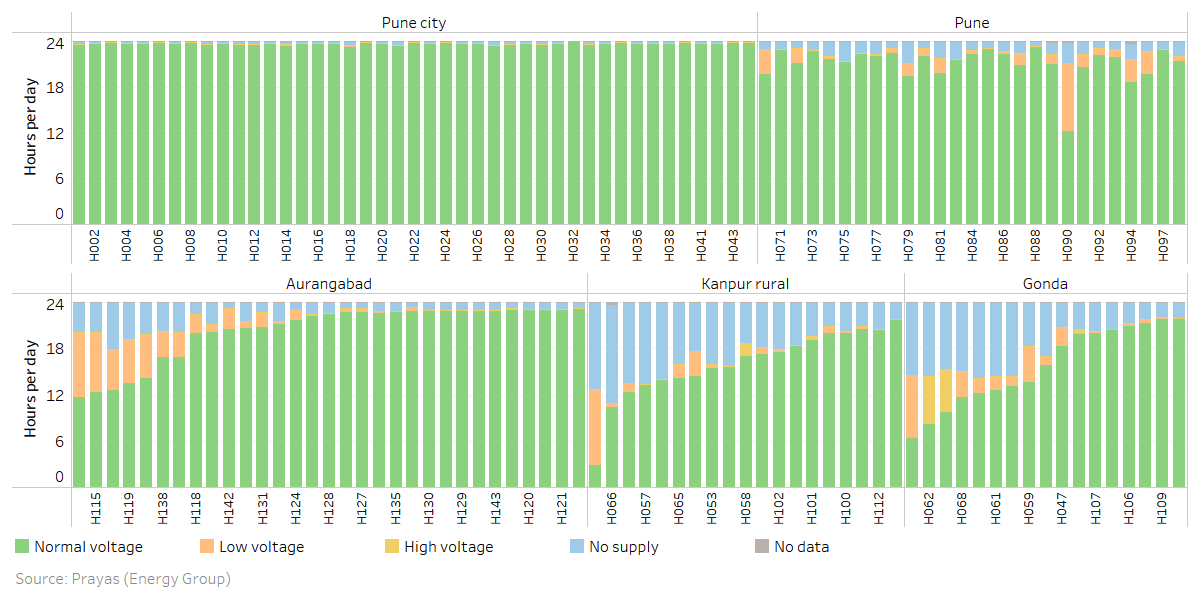
Figure 3: Supply voltage levels
Households in Pune city rarely faced voltage variations beyond the normal range. However, some households in other regions faced instances of both low and high voltage levels. Occurrences of low voltage supply are much higher and can sustain over long time periods for some households. This severely limits safe and productive use of appliances. Occurrences of high voltage were uncommon, except for two households in Gonda district. Monthly quality of supply for one of these households is shown in Figure 4. This rural household is located about 10 km east of the Gonda town and about 150 km east from Lucknow, the state capital. It received high voltage supply, around 280 volts for more than 6 hours a day, between September 2019 and February 2020. The high voltage supply was mostly during night and morning hours in the winter. Most of the issues with supply voltage levels can be attributed to the local distribution transformer (DT) sizing and loading, and the distance of the household from the DT. We could not record these factors due to paucity of data.
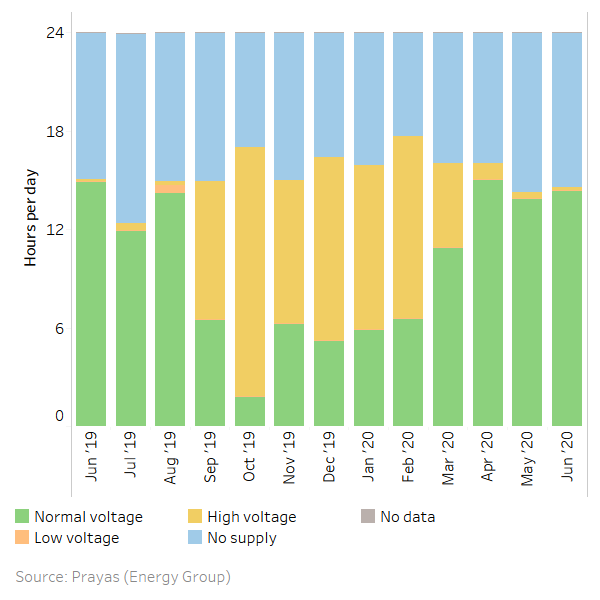
Figure 4: An example of a household with poor quality of electricity supply.
Supply hours as well as the voltage levels varied across time of day as shown in Figure 5. Most of the outages occur during the late morning and afternoon hours. Households typically value the electricity supply in the evening (6 hours between 5 PM to 11 PM) the most as they can use the electricity for lights and televisions. Households in Pune and Aurangabad districts received about 5 hours and 40 minutes of electricity supply on an average during the evening while those in Kanpur rural and Gonda received 4 hours and 40 minutes. As with all the other parameters, there is a significant variation as seen in Table 2.
| Region | Average | Median | Minimum | Maximum |
| Pune City | 5.9 | 6.0 | 5.9 | 6.0 |
| Pune | 5.7 | 5.7 | 5.4 | 5.9 |
| Aurangabad | 5.7 | 5.7 | 5.2 | 5.9 |
| Kanpur Rural | 4.7 | 4.8 | 4.0 | 5.2 |
| Gonda | 4.8 | 4.9 | 3.8 | 5.5 |
Table 2: Variation of average daily electricity supply hours in the evening within the sample
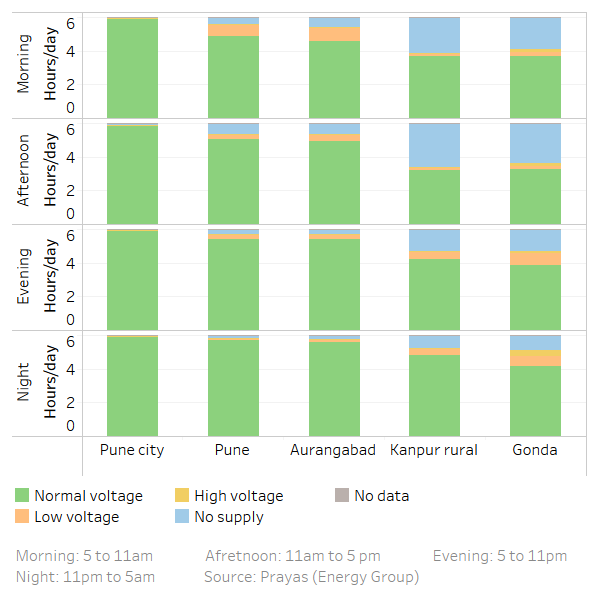
Figure 5: Quality of Supply during the different times of the day.
We also took a closer look at how the voltage varies throughout the day. Figure 6 shows average hourly voltage in January and May 2020, which are winter and summer months respectively.
Households in Pune city, Pune district and Aurangabad recorded a voltage dip in the mornings. This is not observed in Kanpur rural or Gonda districts. On the contrary an increase in voltage is observed at the same time during summer. This could be because of the different nature of loads connected to the grid in different seasons, for example water heaters in households, or commercial loads. Similar voltage dips and seasonal variation was observed at ESMI locations in nearby regions.
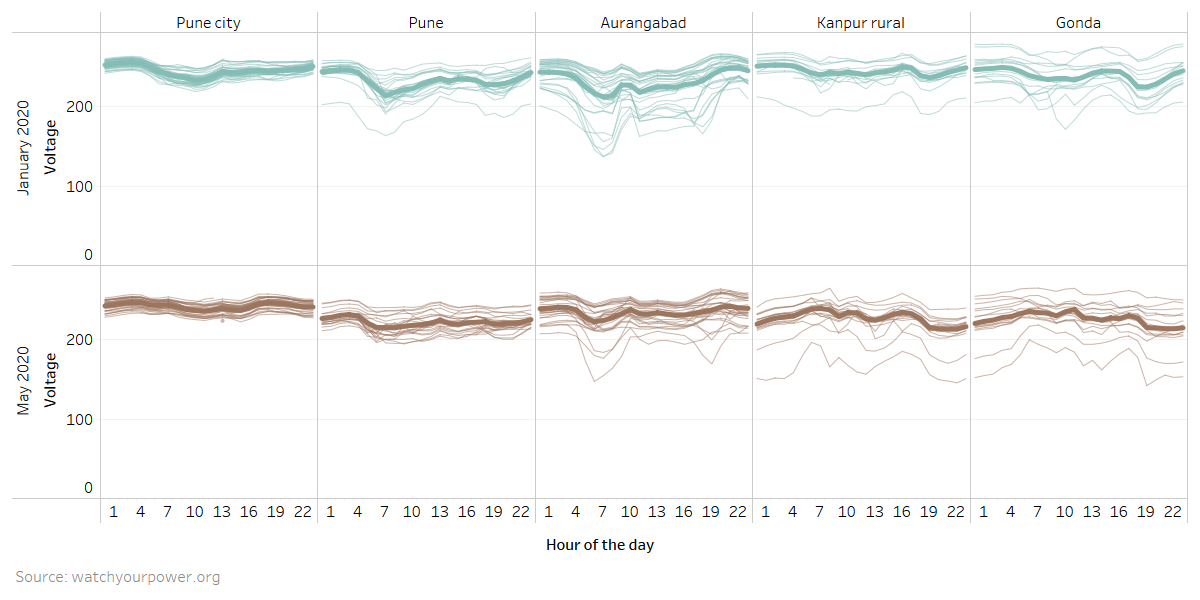
Figure 6: Average hourly voltage
The overall observations show that there is a wide variation in the electricity supply quality and the quality deteriorates as we move away from urban centers. The supply quality in Pune city is better in comparison with Pune and Aurangabad Districts, which in turn is better than Kanpur rural and Gonda Districts. The analysis from such granular data shows that most variations in supply are characteristic of seasons, time of day and/or economic activities in regions. The upkeep of local electricity networks is critical in ensuring 24*7 power supply, which can ensure uninterrupted power at peak demand times. Similarly the overall financial health and power planning strategies of the utilities can significantly improve supply quality during different seasons, and support economic activities alike. Going forward, large scale installations of smart meters can provide reliable and granular supply quality data to the DISCOMs. This analysis shows that such data can certainly help the DISCOMs identify areas of improvement and make proper investment decisions to better the overall supply quality.
Contributors: Aditya Chunekar, Abhiram Sahasrabudhe, Shweta Kulkarni
Please contact Aditya Chunekar (
Suggested Citation: Prayas (Energy Group), ‘Quality of Electricity Supply’, part of blog-series on smart meter data collected under the eMARC initiative, July 2021.
Please click here to read the other posts in this series.