
Insights from smart metering data
eMARC is an initiative by Prayas (Energy Group) to provide insights on electricity consumption in Indian homes. Under eMARC, minute-wise data related to electricity consumption is collected using smart meters from a sample of households and appliances. Interactive dashboards based on the analysis of this data are available on the eMARC website. In this blog series we present key observations based on the data collected from 115 households from January 2018 to June 2020. The households include urban households from Pune City and semi-urban and rural households from the districts of Pune, Aurangabad, Kanpur Rural, and Gonda. In this post we present the insights on the impact of different regulatory accounting mechanisms on the economics of installing solar rooftop systems.
Please read this post for details on how emarc works and the description of our sample.
Key Takeaways
- A combination of net-metering mechanism and the existing capital subsidy makes the solar rooftop investment highly attractive (higher NPV and short payback periods), particularly for households with higher consumption.
- Net-billing mechanism reduces the returns and increases the payback periods compared to net-metering mechanism. However, the solar rooftop investment still remains highly attractive.
- Storage systems increase the NPV with the net-billing mechanism slightly. However, the value will increase significantly if time-of-day tariffs are adopted.
India has set a target of installing 40 GW of solar rooftop by 2022. The progress towards the target has been slow with about 7 GW installed by the end of 2020. This is despite several incentives in place at both national and state level. The Ministry of New and Renewable Energy (MNRE) provides a capital subsidy of 40% for smaller residential rooftop installations up to 3 kW. Most of the states also have conducive regulatory frameworks for the solar rooftop installations.
In this post, we examine the impact of the different regulatory accounting arrangements on the net present value (NPV) and the payback period of installing solar rooftop for different households in our sample. We present the analysis for three households with different levels of average electricity consumption per month: 300 kWh (H030), 150 kWh (H015), and 50 kWh (H029). All of these households are in Pune city. We estimate the impact with and without the MNRE subsidy. The size of the solar panels system is chosen such that the annual solar generation is approximately equal to the total annual consumption of the household. This results in a 2 kWp system for the household with monthly electricity consumption of 300 kWh and 1 kWp system for the other two households. The solar generation, consumption, and the instantaneous consumption of the generated solar energy over the year is shown in Figure 1. Currently, Maharashtra Electricity Regulatory Commission (MERC) allows the net-metering arrangement for all the residential consumers. However, as the number of consumers with solar rooftops gradually increases, it will be imperative to adopt different accounting mechanisms which are fair to both the distribution companies and the consumers. We examine the three different accounting mechanisms: net-metering, gross-metering, and net-billing. We also calculate the impact of installing a battery-inverter system. All the assumptions made for the analysis are given in the Annexure below.
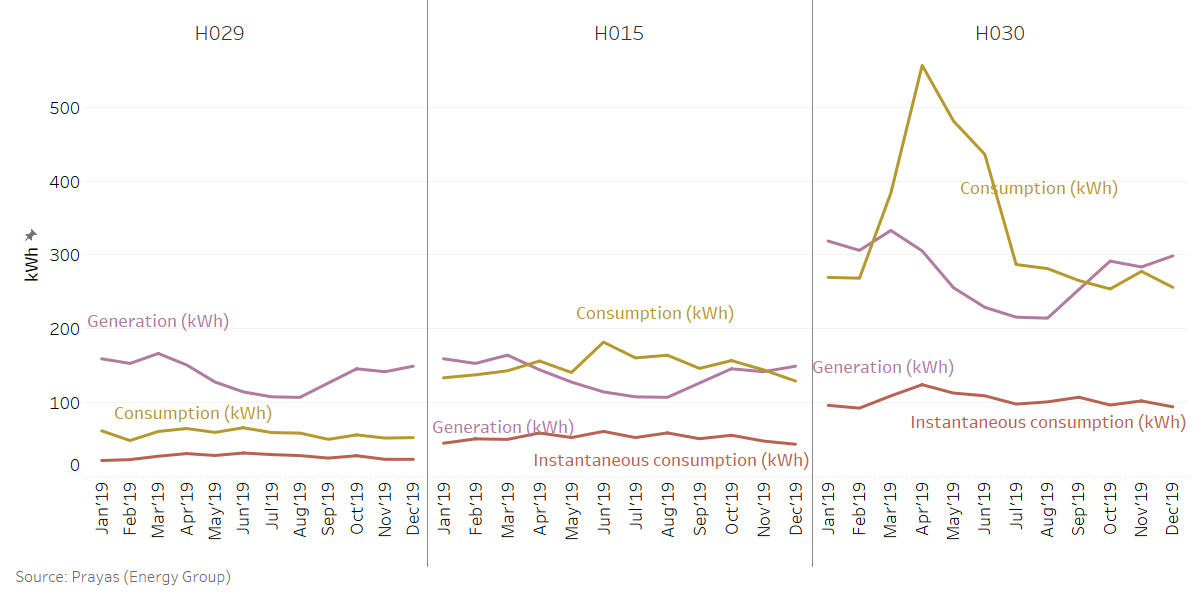
Figure 1: Monthly solar generation and consumption of selected households
Net-metering
In the net-metering arrangement, the electricity generated by the solar rooftop is used by the household and balance, if any, is exported to the grid. The amount of the electricity sent to the grid is reduced from the household’s total monthly import from the grid. If the monthly export is higher than the import, then it is carried forward every month and the accumulated carried forward units are compensated at a fixed tariff at the end of the financial year. In Maharashtra, this tariff is fixed at ₹ 2.9 per kWh. The variable retail tariff for the residential consumers in Maharashtra is ₹ 4.91 per kWh for 0-100 kWh and ₹ 8.88 per kWh for 101-300 units for FY 2020-21. As can be seen in Figure 2 the NPV, at a discount rate of 10%, is positive for all the three households with the payback periods ranging from about 2 years for the H030 to more than 5 and a half years for H015. The investment is substantially beneficial for H030 and H015 with shorter payback periods even without subsidy. The internal rate of return for H030 with subsidy is as high as 45% indicating a strong financial incentive for installing the roof-top systems. The NPV for the H029 is low as there is substantial annual surplus in export which is compensated at a very low tariff. In net-metering, there is no incentive for the consumers to match their consumption to the rooftop solar generation for its maximum utilization. All the solar generation is compensated at the marginal retail tariff (or the fixed tariff in case of annual surplus). Hence, there is no impact of the consumer load profile on their electricity bills.
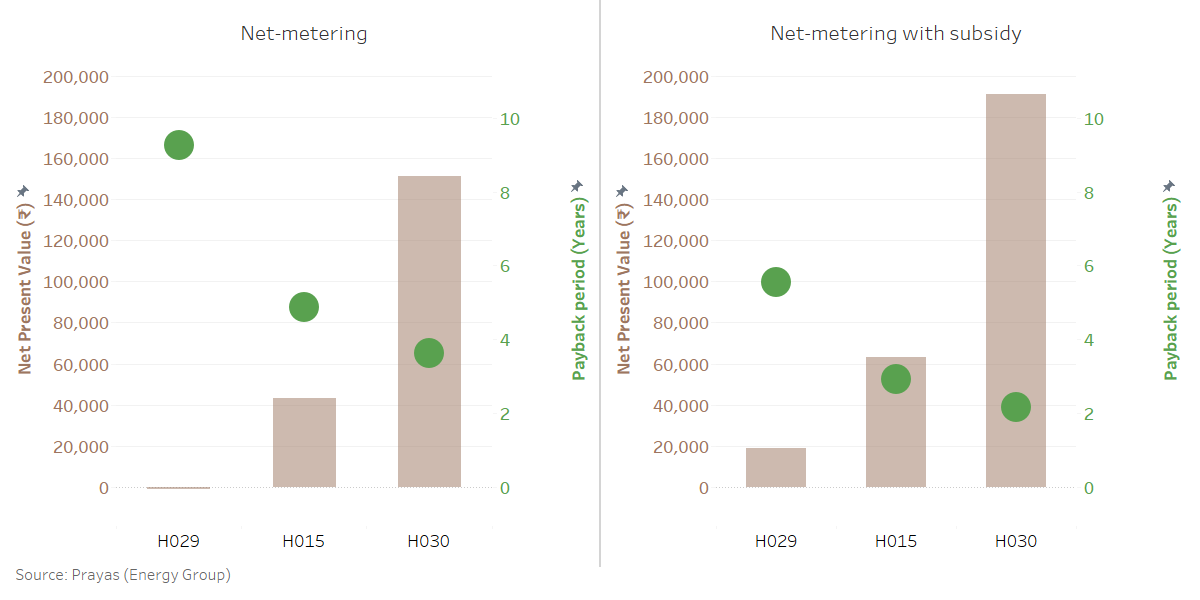
Figure 2: NPV and payback period for selected households in net-metering arrangement
Gross-metering
In the gross-metering arrangement, all the electricity generated by the solar rooftop is exported to the grid. This electricity is compensated at a tariff pre-determined by the regulator. In Maharashtra, this tariff is the average power procurement cost which is about ₹ 3.9 per kWh. As this is less than the marginal retail tariff, benefits to the consumers are substantially lower than the net-metering arrangement as can be seen in Figure 3. The NPV is positive for all the three households with or without the capital subsidy. Similar to the net-metering arrangement, all the solar generation is being compensated (albeit at a lower rate). Hence, the load profiles of the households does not matter and they have no incentive to match their load with the rooftop solar generation.
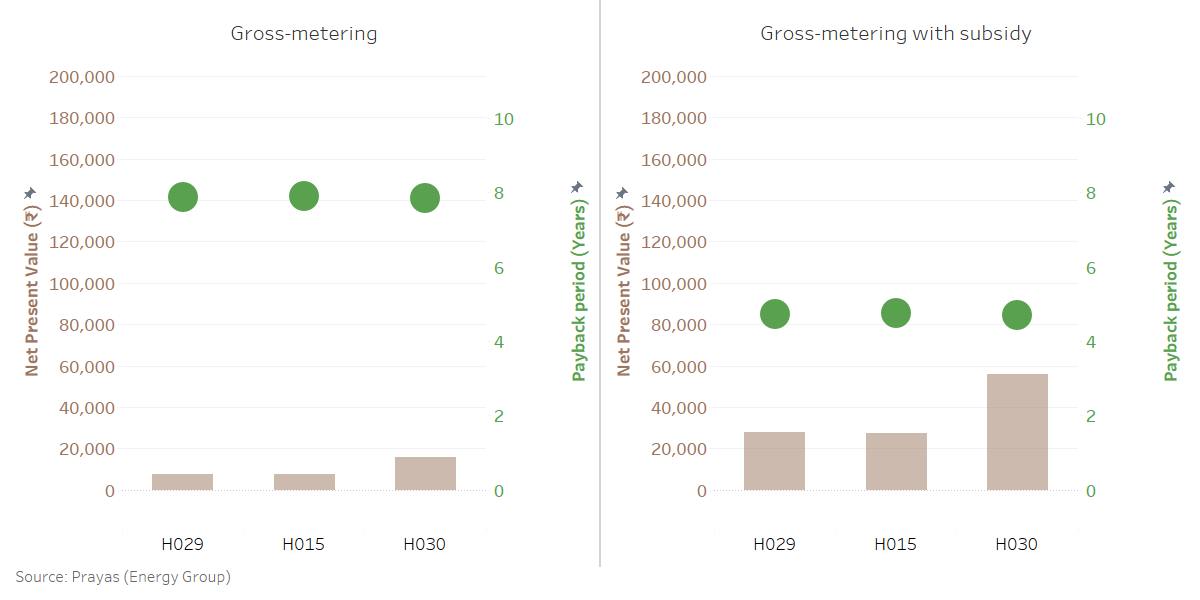
Figure 3: NPV and payback period for selected households in gross-metering arrangement
Net-billing
In the net-billing arrangement, the electricity generated by the solar rooftop is used by the household and balance, if any, is exported to the grid similar to the net-metering method. However, the energy exported to the grid is compensated at a fixed tariff. In case of Maharashtra, this tariff is the average power procurement cost of ₹ 3.9 per kWh. In this case, the instantaneous consumption of the solar generation by the consumer is compensated at a much higher rate (equivalent to the marginal retail tariff) than that exported to the grid. Hence, the consumer has an incentive to shift their load as much as possible to match the solar generation. As can be seen in Figure 4, the NPV values reduce substantially as compared to the net-metering arrangement except for H029. In this case, the NPV is higher as the significant annual surplus in exports is compensated at a higher tariff. It has to be noted that the NPVs are still higher and payback period shorter with a net-billing system, particularly with the capital subsidy.
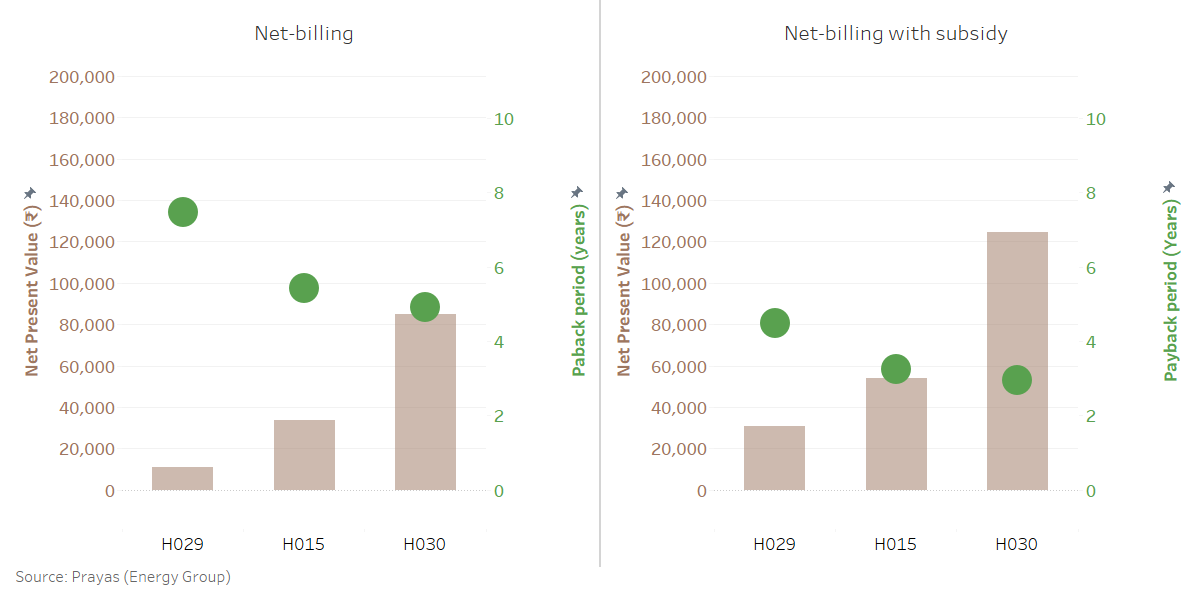
Figure 4: NPV and payback period for selected households in Net-billing arrangement
Net-billing + Storage
We also look at a scenario where a battery-inverter system is used in the household to store the excess solar generation during the day and use it other times. We assume a 2 kW/ 2 kWh battery for all the households. We did an hourly simulation of the entire year where the excess solar generation is stored in the battery. When the solar generation is not sufficient to meet the household demand, it is met by the battery first and when the battery reaches its minimum level, the demand is met through the grid. As can be seen in Figure 5, the NPV of the system is lower than that of net billing for H015 and H030 and is negative for H029 without subsidy. However, the battery slightly improved the NPV for H030.
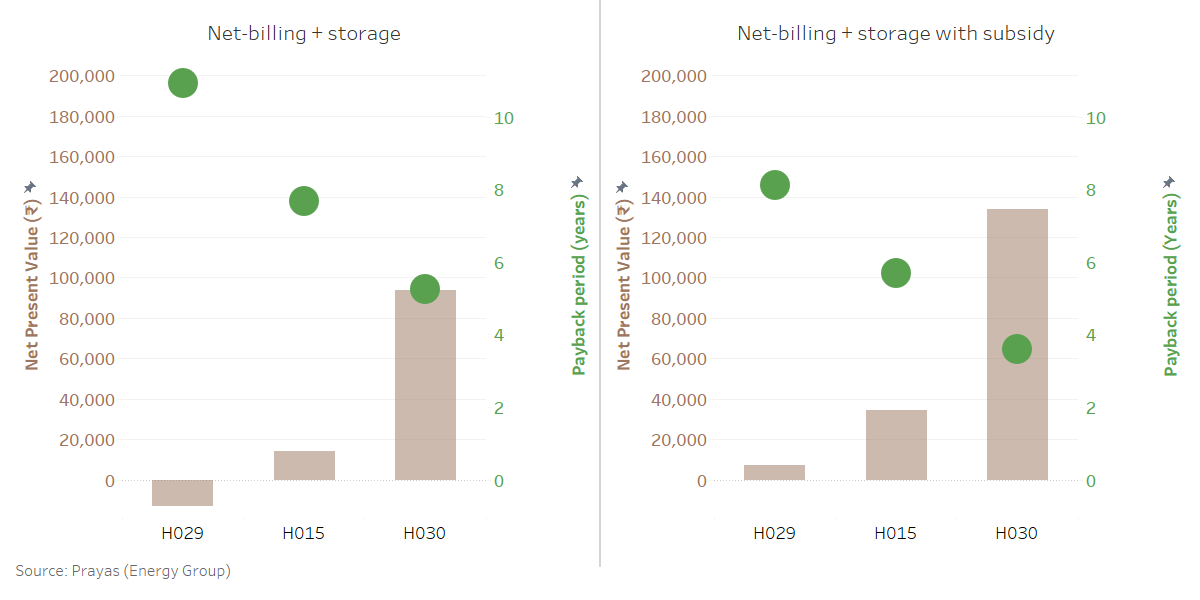
Figure 5: NPV and payback period for selected households in Net-billing + storage arrangement
Currently, there is no time-of-day (ToD) tariff for residential consumers in Maharashtra. However, as the share of solar energy in the total generation mix grows, there will be a stronger case for time-of-day tariff with higher tariff at evening times when the solar generation goes down. This can increase the value of the storage systems as it can delay the household’s import from the grid. This can be seen in Figure 6 where the evening import from the grid gets delayed significantly as the size of the battery increases.
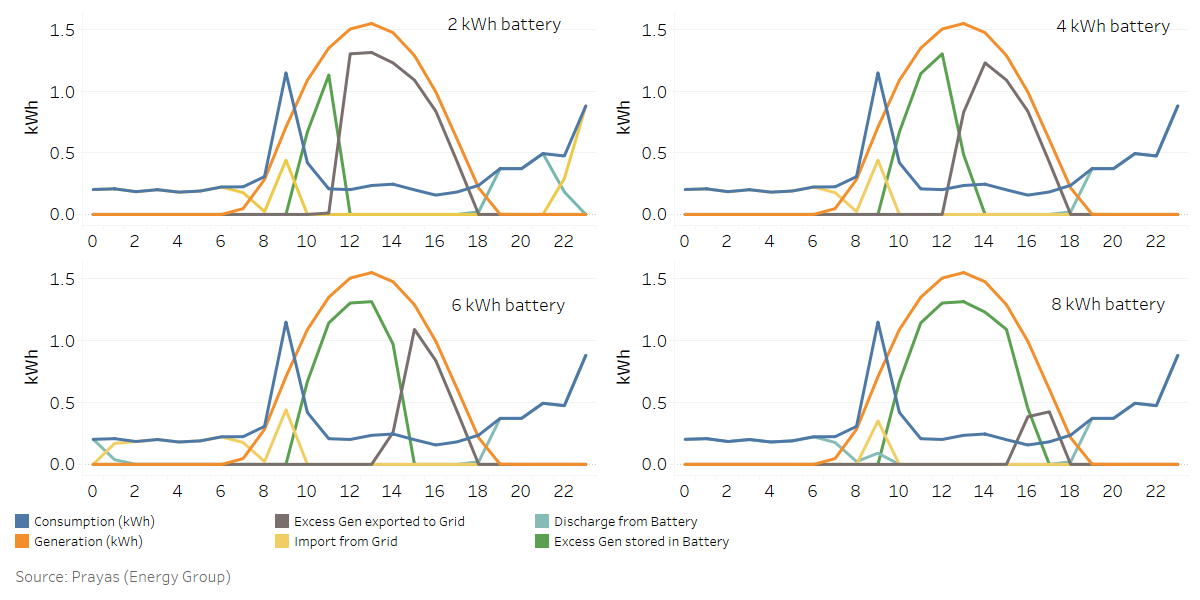
Figure 6: A single day generation, storage, and consumption profile for H030
To conclude, the high resolution smart meter data can be very useful in sizing the rooftop solar panels, battery-inverter systems as well as devising balanced and fair regulatory accounting mechanisms for rooftop solar installations. Net-metering and gross-metering mechanisms offer significant monetary returns and shorter payback periods for the households. But there are no incentives for the households to shift their consumption to day-time or install storage systems for maximum utilization of their rooftop solar generation. Time-of-day tariffs and falling battery costs can change this.
Annexure: Assumptions
- The size of the solar panels system is chosen such that the annual solar generation is approximately equal to the total annual consumption of the household. This is the practice that is usually employed by most of the consumers and service providers.
- System cost is considered to be ₹ 50,000 per kWp. This is higher than the MNRE's benchmark costs of about ₹ 43,000 per kWp for 1-2 kW systems. We have also considered a life of 20 years, instead of 25 years, to account for performance degradation. The MNRE subsidy is 40% of the system cost.
- Discount rate is assumed to be 10% for the NPV calculations.
- We assume that MSEDCL (the distribution company supplying electricity to Pune households) will revise its tariff at a modest 1% per year. We only consider the wheeling and energy charges.
- Solar generation profile is taken for the year 2019 from the National Renewable Energy Laboratories (NREL)'s System Advisor Model (SAM). We scaled down the generation profile by 25% as the average daily generation of 6 kWh for a year for 1 kWp by SAM is on a higher side compared to observed values as reported anecdotally.
- We considered the battery-inverter costs of ₹ 20,000 for 2 kW / 2kWh battery. The battery life is assumed to be 10 years. We also assume 1% annual maintenance costs.
Contributors: Aditya Chunekar, Abhiram Sahasrabudhe, Shweta Kulkarni
Please contact Aditya Chunekar (
Suggested Citation: Prayas (Energy Group), ‘Solar Rooftop Economics’, part of blog-series on smart meter data collected under the eMARC initiative, July 2021.
Please click here to read the other posts in this series.

