The behemoth challenge of electrification of 99.93% households is said to have been achieved over the last few years. Focused efforts through Rajeev Gandhi Grameen Vidyutikaran Yojana (RGGVY), Deen Dayal Upadhyaya Gram Jyoti Yojana (DDUGJY) and Pradhan Mantri Sahaj Bijli Har Ghar Yojana (SAUBHAGYA) have made this possible. Network augmentation schemes like Integrated Power Development Scheme (IPDS), Restructured Accelerated Power Development and Reforms Programme (R-APDRP) and DDUGJY have also helped in reducing the AT&C losses.
It is indeed remarkable that the grid has been able to reach most households across the country, making affordable electricity available to all. However, despite focused efforts consumers connected to the grid do not receive 24*7 power supply. Unreliable and poor quality of electricity supply leads to production losses, damaged equipment and forces consumers to rely on expensive back-up systems.
Most of the supply quality issues arise from the sub-optimal performance of distribution network and power planning systems. Electric utilities have continued to justify large capital investments and tariff increases by citing the goal of improvement in supply quality. However, it is difficult to measure the true impact of these investments in supply quality for consumers. The current systems of monitoring can only measure supply quality data at feeder and in some cases distribution transformer level (DT). This data does not adequately represent the interruptions at the consumer end due to lack of consumer mapping to feeders and DT’s in most utilities. Additionally, most of the data is manually recorded at utility substations, and there is no independent verification mechanism.
The Electricity Supply Monitoring Initiative (ESMI) launched in 2015, by Prayas (Energy Group), (PEG) was one step in the direction. ESMI was developed with the aim of providing independent feedback on supply quality at consumer end. As of June 2021, ESMI has recorded almost 10 million location hours of supply quality data from over 400 locations spread across the country. This entire data set has also been made publicly available through a website and a dataverse.
This blog piece is an introduction to the Electricity Supply Monitoring Initiative. Through this blog series we intend to share our insights on supply quality from data captured through the ESMI and our learnings from the implementation of the remote monitoring initiative spread across different urban, semi-urban and rural areas in the country. The other blogs in this series include details on insights on supply quality data from different states, regions and locations in the country, and a fair share of the challenges in implementation of ESMI and key learnings which can be adopted for better supply quality monitoring for consumers.
ESMI Relevance
At a time when several efforts are being made to improve access to electricity, accurate data on reliability and quality of supply to these consumers is still missing. Some efforts of making supply quality data accessible through National Power Portal or Urja Mitra and regulatory submissions are inadequate as most of this data is recorded at feeder level, and thus may not capture all interruptions at the consumer level. Furthermore, the possibility of the data being captured manually raises questions on the accuracy. Since consumer mapping to feeders and DT’s is practically non- existent this data is hardly representative of the outages faced by consumers.
ESMI was developed with an objective to address this very concern by building an evidence-based feedback on supply quality at consumer end. This was in line with PEG’s approach to bring Transparency, Accountability and informed Participation (TAP) to the Power sector to address its core issues. Our research indicated a significant variation in supply quality across states, regions, and districts but there was lack of data evidence at the consumer end to support it. PEG conceptualized the idea of monitoring actual supply quality data using state of the art Internet of Things (IoT) based devices which record minute by minute voltage supply. This project was supported by Google Impact Challenge award in 2013 and ESMI was publicly launched in 2015.
ESMI Expanse and How does it work
As of 2021, ESMI has monitored 400 consumer locations spread across 23 states since the time of its launch. ESMI has collected almost 10 million location hours of data. The minute by minute data gathered from ESMI is made publicly available on the website watchyourpower.org. ESMI uses a simple plug and play device which can be connected to a regular electricity supply socket, the GPRS based communication module transmits the minute by minute voltage data captured by the voltage measurement chip to the central server. This data is then analysed using a customised software to generate reports. More details regarding ESMI devices can be found in this post.
ESMI locations were classified into three types, Megacity locations (as classified by the CEA, typically population more than 20 lakhs), other municipal areas (which are cities but not megacities) and rural areas.
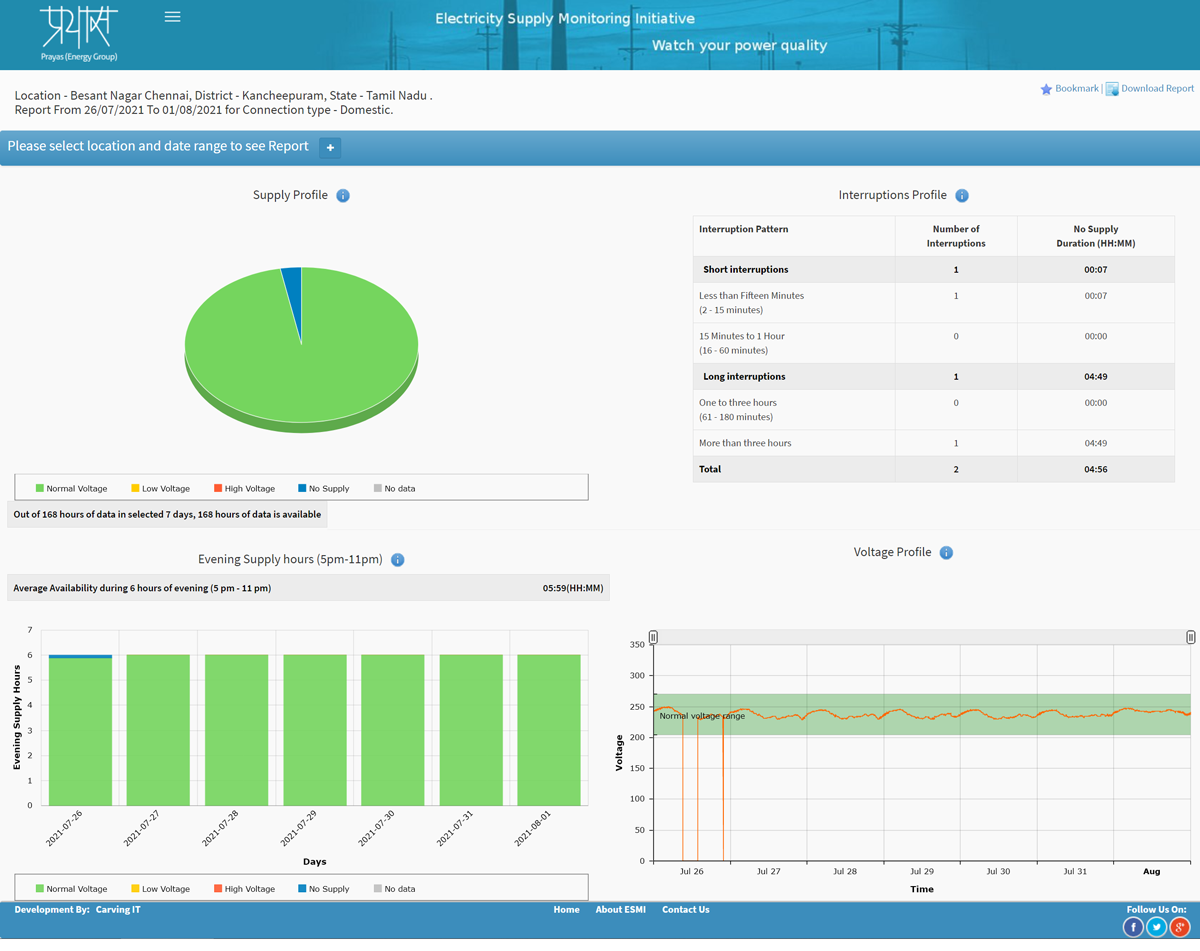
The ESMI website makes supply quality data available to users in easy to visualize location-based reports, summarized reports covering a few hundred locations, state specific reports and analysis reports. The sample of such reports, publicly available on www.watchyourpower.org is presented below.

Figure 1: Sample ESMI location report on watchyourpower.org
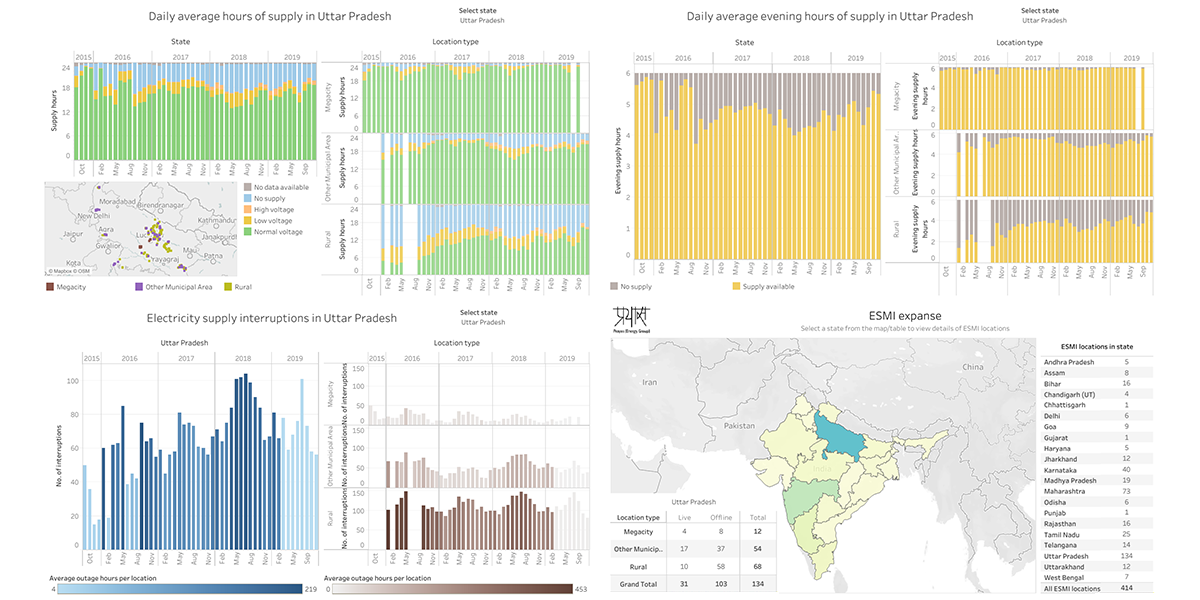
The website also allows users to view and download summary and analysis reports for different states, locations and urban -rural supply quality analysis reports. Presented here are visuals of some of these dashboards and analysis. The dashboards show supply quality variations across years and in different megacities, other municipal areas and rural areas. The summary analysis on the other hand captures monthly supply quality variations in different cities, states and rural areas.

Figure 2: Sample ESMI State dashboard on watchyourpower.org
This data has allowed several stakeholders including policy makers, regulators, academics, researchers, media and civil society organizations to get a better understanding of the supply quality situation across the country. This data indicates that although the quality of supply has generally improved over the past five years, the progress has been uneven and much work still needs to be done for further improvement. Further blogs in this series highlight the nature and extent of this problem.
ESMI has not only found relevance in India but 5 other countries as well, where pilot projects have been implemented along with country partners. Data gathered through these pilot projects has gained similar responses from media and sector actors in these countries.
ESMI has also gone through its fair bit of challenges in the process of development of an accurate, low cost and low intervention-based monitor to actual installations. Learnings and challenges from this vast exercise have been detailed in an upcoming blog post. We believe learnings from ESMI can be useful for other larger scale measures to monitor supply quality and even the proposed rollout of smart meters. ESMI has proven that monitoring supply quality using low cost IoT based meters is certainly possible and an important step towards improving supply quality.
Contributors: Shweta Kulkarni, Abhiram Sahasrabudhe, Aditya Chunekar, Shantanu Dixit
Please contact Shweta Kulkarni (
Suggested Citation: Prayas (Energy Group), ‘Electricity Supply Monitoring Initiative (ESMI)’, part of blog-series on insights from monitoring quality of electricity supply at consumer locations in India under the ESMI, August 2021.
Please click here to read the other posts in this series.

